Over the last two years there has been an evolution in the way that soil nutrient mapping is carried out. This has been driven by the launch of TerraMap by Hutchinsons in 2019. Terramap came at the perfect timing for farmers looking for that next level of accuracy in understanding their soils in order to reap the most benefit for their crops through nutrient mapping and soil conductivity scans.
TerraMap uses gamma-ray radiation technology to deliver resolutions of over 800 points/ha, providing high definition mapping of all common nutrient properties, pH (e.g. % clay, % sand, % silt), soil texture, organic matter and CEC as well as elevation and plant available water. The results from TerraMap are used to create maps within the Omnia precision farming system which can then be overlaid with additional field information such as black-grass, yields and so on, to create the most accurate, consistent and detailed variable rate plans.
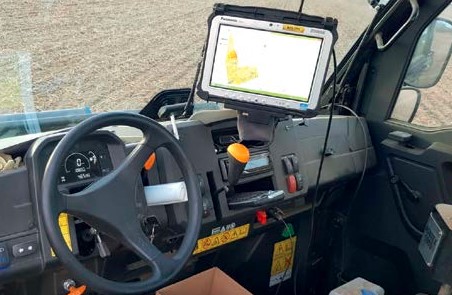
The infield process of collecting the data is carried out in 2 very simple steps; scanning by driving a light weight all terrain vehicle fitted with the sensor over a field, and then taking soil samples to allow for each scan to be used to create the individual map layers.

Manufactured by Canadian company SoilOptix, TerraMap’s scanning technology is based on a scaleddown version of airborne sensors that originates in mineral prospecting, and has been used in other countries successfully. The TerraMap sensor is noncontact and pre-calibrated upon manufacturing. It’s an entirely passive sensor. The standard field practise is the scanner is mounted roughly 600-700mm above the ground and the vehicle is driven around 10-12 mph and at 12m swath widths. The sensor is measuring gamma radiation that is being naturally emitted form the soil. Specifically it is measuring Caesium -137,Uranium-238,Thorium-232 & Potassium-40.
Traditional zonal and grid soil sampling, do not by their sheer methodology provide the level of accuracy that TerraMap offers. With the grid system you create a 100x100m grid across the field, taking samples at each point. A map is then generated that extrapolates properties between the data points.
A zonal system uses an electro-magnetic (EMI) or conductivity scanner to assess soil properties into zones of similar character. Samples are then drawn from within each zone.
The resolution isn’t good with the grid system – the way the smoothing is carried out by the software between data points can be quite crude. The problem with EMI scanning is repeatability – it’s massively affected by soil moisture, so the picture you get of your soil in Sept can be completely different to a scan taken in April. The zonal sampling resolution also tends to be poor – on average one sample represents 2.5ha. As it’s an entirely passive sensor, you can travel from harvest through until March without disturbing an autumnsown crop. It picks up the unique radioactive signature emitted by the soil that’s influenced by its nutrient and mineral content. That signature can be translated back to the core properties.
Just like EMI scanning, the sensor has to be groundtruthed, so soil samples are taken within each field to help the algorithms align the radioactive signature to the actual soil properties. But unlike EMI, that signature remains the same and unique to the point in the field, regardless of moisture, temperature, tillage state or crop cover. Repeatability is one of the key aspects we tested before we launched TerraMap. So several fields were scanned just after harvest when they were dry and in stubble, and were re-scanned as soon as they were fit to travel in early spring. The results are virtually identical – we have real confidence the scanner is measuring something repeatable.
It’s also a one-pass system. Just like an EMI scan, the field is travelled in 12m bouts. The initial scan gives you a map of the raw data points that are displayed on a tablet in the cab. But unlike EMI, the on-board software then uses that information to highlight points within the field to return to for detailed analysis. Before leaving the field, the sensor is returned to a number of pre-defined sampling points. At these points, the spectrometer picks up a more detailed signature and we take a representative soil sample for later analysis.
Terramap is available at two service levels: standard will deliver ten map layers to the grower, directly replacing other soil services currently available. This brings in sand, silt and clay content, giving individual layers of percentage content, as well as a texture map, calculated using the industry-standard soil texture classification.
For Omnia users, it will be the soil texture layer that’s used in combination with seedbed condition, weed and slug pressure to generate a variable rate drilling plan.
In addition, phosphate, potash and magnesium index maps are returned, along with pH, while an elevation map is also generated. The nutrient and pH layers will directly inform variable rate application maps. Premium service provides information or layers that you don’t get from a standard precision soilsampling service such as levels of the nutrients calcium, sodium, sulphur, manganese, boron, copper, zinc, molybdenum and iron. It’s seen as unlikely that growers will use the maps to variably apply micronutrients. More likely, the information will be used with tissue testing, for example, to identify potential areas of deficiency and to target areas for further investigation.
Organic matter levels and cation exchange capacity (CEC) are two further layers of “good background information” returned by Terramap. Again it’s unlikely growers will use the information to directly spatially apply inputs, although it may indicate areas that warrant further investigation. The final layer is plant-available water based on clay, silt and organic matter content. In the first instance, this could help modify irrigation scheduling, but we believe the information can be used to tailor agronomy closer to crop potential, spatially enhancing overall performance.
The value in the maps may come through the barometer they offer on general soil health, informing how to build resilience into the arable system, and as a basis for applying for future subsidy payments linked to provision of public goods.
TerraMap Carbon
This spring has seen a further exciting development in TerraMap- the ability to provide the most accurate baseline measurement of both organic and active carbon in the soil and is now available to UK farmers. Despite growers coming under increasing pressure to look at their carbon footprint in response to the NFU’s commitment for UK farming to achieve Carbon net zero by 2040 – until now there has been no accurate means of measuring carbon in the soil – and unless you can measure carbon there is no way it can be managed.
The pressure to manage carbon is only going to become greater as other industries are already showing positive change. As an industry UK Farming plc is in a unique and enviable position as farming activities can make positive changes to carbon, which most other industries are not able to do. This challenge comes at a time when the arable industry is facing great change in the light of the loss of basic farm payment, and many growers may well be questioning the importance or relevance of carbon management as potential profit margins are threatened.
We need to move away from seeing carbon footprinting as a burden or simply a tick-box exercise and see that this is beneficial, as a proxy measurement for efficiency and profitability of a farm as well as simply a measure of waste.
So it’s clear that there are benefits such as lower input costs to having a negative carbon balance before even getting to the Carbon bit. A reduced carbon footprint can only be achieved through more efficient fertilisers, different technologies, better soil carbon management or considering the energy used in storage, so it’s a win– win on all levels. In light of these challenges, we have been investing heavily in developing services and technologies that can be utilised at farm level to allow growers to work towards these goals- and the development of Terramap carbon is an exciting and unique development that reflects this approach.

Terramap Carbon is available through the standard or premium service as is the case for soils nutrient scanning. The standard service now also includes total organic carbon in terms of percentage carbon and tonnes/ha whilst the premium service also offers both total organic and active carbon percentage and tonnes/ ha – that is the percentage of carbon that’s active in the soil. Once I have the carbon measurements what can I do with them to achieve any of the potential benefits we have outlined? This is one of the most common questions with regards to carbon management. Nick Wilson of Hundayfield Farm just outside York is the host of the Hutchinsons Helix North Farm, one of the Helix Farms network where Terramap Carbon has been trialled and tested.
His farm consists of 260ha of mainly arable cropping, with land let out for potatoes and winter sheep grazing on stubble turnips. There is also bed & breakfast cattle which utilise the farm buildings and some of the permanent grass in the rotation. For Nick and his agronomist Sam Hugill, carbon is just a part of the whole farm system, but both believe that it is useful to obtain a baseline measurement now, so that they have a baseline figure to work from going forward.

The results of the Terramap Carbon scanning showed up large differences in the carbon balance between the arable fields and permanent pasture, as you would expect. The average across the arable fields was about 30t/ha of organic carbon and it was almost double that for the permanent pasture. Having a baseline measurement means that Nick can look not just how to manage processes to build carbon on the arable fields up to the levels of that of the pasture, but also to prevent any unnecessary losses of carbon. For example looking at the impact of root crops on carbon or using cover cropping to prevent having any bare land over winter and reducing loss this way.
The carbon management tool allows users to look at these scenario’s using real and accurate measurements and then quantify the impact on carbon. After all as Lord Kelvin, physicist and engineer said: “When you cannot measure it, when you cannot express it in numbers, your knowledge is of a meagre and unsatisfactory kind.”