EVALUATING THE IMPACT OF PESTICIDE USE ON NATURAL CAPITAL
Natural Capital is being measured in novel ways and carbon accounting is now commonplace. It is difficult to be precise about the measurement of the effects of different management practices on soil carbon, so it seems likely that the adoption of management which we know to be more carbon efficient will be a more important short-term yardstick than the increments of this or that measurement of soil carbon. Among the plethora of carbon counting models, one will probably emerge as the dominant approach and, in time, we will all adopt the same standardised system which evaluates our initial progress through the practices we adopt. In the longer term this will be validated through more tangible measures of success, showing the sequestration which can be achieved in the longer run..
The position with measurement of carbon is likely to be repeated after a lag in time with biodiversity – the other big area of Natural Capital upon which we have such a large potential impact, both positive and negative. Just as it may be more appropriate to measure the adoption of carbon efficient management than actual soil carbon to assess progress toward Net Zero, it seems we need some effective measurement of pesticide impact to assess our progress toward a reduction on negative effects on biodiversity. Well-planned changes in variety, rotation and agrochemical choice offer significant opportunities to minimise the unintended impact of pesticide use to protect the environment in which we live and work and the soils which we curate. Additionally, we will need to demonstrate this careful management to the wider world.
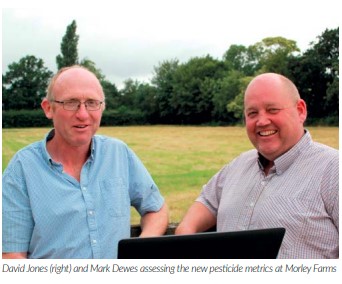
This is the conclusion of studies with a new approach to measurement at Morley Farms in Norfolk (the farming enterprise of The Morley Agricultural Foundation). I have been working on this approach with my old college friend and farm manager, David Jones who does all the farm’s agronomy.
There are no national targets for pesticide impact reduction yet, but the pressure will only grow as pesticide use becomes more of a consideration in our ‘social licence to operate’. For our economic sustainability too, we have to use the products at our disposal in the best-informed and targeted way.
Current metrics used in the Pesticide Use Survey including overall weight and treated hectares are of limited use in assessing comparative impact of different pesticide choices as they take no account of the concentration or rate of use of different products. Any improvement of these measures needs to be sufficiently simple and understandable to all concerned to be of real value. Measures like Pesticide Load Index (PLI) and Environmental Impact Quotient (EIQ) based on multiple and often poorly understood factors in complex equations are available, but their complexity and lack of transparency makes them both inappropriate and impractical. Treatment Frequency Index (TFI) appears be a more useful option and has been an important part of the development of pesticide metrics in countries like Denmark.
Measuring the number of full rate equivalent applications of each product used per hectare, TFI is quick and easy to calculate from existing field records. This makes it simple to incorporate into existing field recording for individual monitoring by crop, farm, regional and national reporting scales. TFI doesn’t take complete account of the relative equivalence of different pesticides but being based on the full recommended label rate for each product – derived from extensive toxicology and other studies under-pining their official authorisation – it is a good proxy for pesticiderelated harm. To develop TFI further, weightings for specific products from the Harmonised Risk Indicator (HRI) system used within the EU to track the impact of pesticide use. This system awards fewer weighting points for the more environmentally benign products in the calculation and could help to interpret the relative potential impact of different active ingredients.
For a practical example of how the system could work we can examine the results from Morley Farms which extends to around 750ha in several holdings, 700ha of which are cropped. Winter wheat and sugar beet are the mainstays of a flexible rotation which has been extended in the past two seasons with substantially more spring cropping and no oilseed rape to improve economic as well as environmental sustainability. David Jones explains: “At Morley Farms our farming is closely interwoven with long-term research and education. We focus on securing the best possible performance from our cropped land, so we need less of it for production, leaving more for the wildlife features and habitats we have been actively creating and managing for more than 25 years now.
“We are passionate about minimising the unintended consequences of the crop protection inputs essential in our cropping through the best-informed Integrated Pest Management (IPM) too. To do this we need a much better way of monitoring pesticide use and impact than we’ve had to date.”
Morley Farms cropping records over the past decade show a wide variation in pesticide use from year to year as David and his team have responded to different rotational and seasonal pressures.
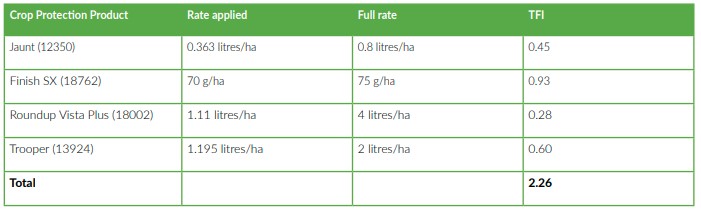
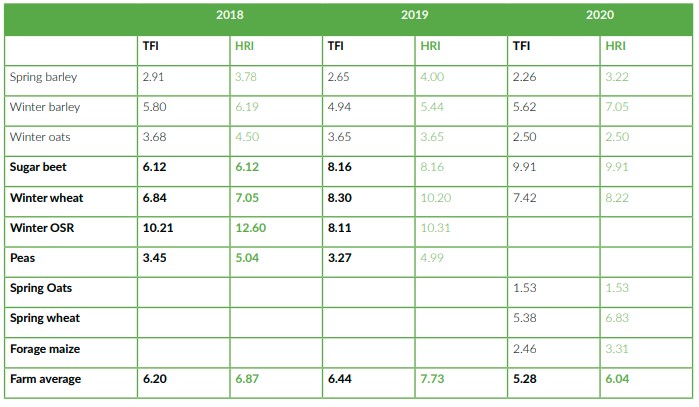
Applying the new metrics to three years of full field records from 2018 to 2020 shows the annual whole farm Treatment Frequency Index varying between 5.3 to 6.4 and averaging 6.0 – indicating an average of six full rate equivalent pesticide applications per hectare. Table 1 shows the calculation for Spring barley in 2020.
Weighting these applications for their relative potential harm here gives an average three-year Harmonised Risk Indicator score of 6.9 (varying from 6.0 to 7.7 depending on the season and cropping Table 2).
Table 1. Treatment Frequency Index (TFI) calculation
Spring Barley 2020
Oilseed rape stands out as a high impact crop on both measures. While a bigger swing than intended to spring planting following seriously disrupted winter wheat drilling undoubtedly played a part, it can be no coincidence that dropping OSR from the Morley rotation in 2020 was accompanied by a reduction of around 20% in both TFI and HRI.
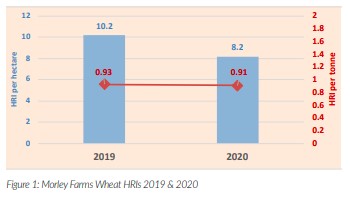
“Although our overall rating will always vary from season to season depending on rotation, crop condition and pest pressures, the rolling average three or five year HRI should provide us with a good indicator of how well we are doing in moderating our pesticide impact.” “Alongside margin, it looks like it could be a really useful routine measure of individual crop and farm performance for us. Especially if we calculate it on a per tonne basis rather than just per hectare to reflect the value of crop protection in supporting higher production. “A per hectare HRI of 10.2 in 2019 and 8.2 in 2020, makes our earlier wheat crop look worse. But factor in the 11t/ha yield average in 2019 against 9.0 t/ha in 2020 and the positions are virtually identical at 0.93/t and 0.91/t respectively (Figure 1).
“Knowing the relative pesticide impact of our different crops from past experience also provides us with additional intelligence to take into account in our rotational planning, The HRI data has already underlined the pesticidereducing value of eliminating OSR from our rotation in 2020. Although on only a single season’s figures, it strongly suggests introducing spring oats and forage maize could have particular value here too – in addition to their other benefits.
Table 2: Morley Farms Pesticide Impact Metrics (2018-2020)
TFI – Treatment Frequency Index; HRI – Harmonised Risk Indicator
“Having HRI as a standard metric in our crop performance monitoring would give us a really good measure of pesticide impact to take into account in our improvement efforts. It would allow us to set targets for reducing our reliance on pesticides as we plan ahead; develop our cultural controls to help us meet them; and track our progress in achieving them field-by-field, crop-by-crop and season-by-season. “Precise measurement standards need to be agreed by all concerned but could be useful to incorporate into ELMS – as an IPM target perhaps?”
Applying the Harmonised Risk Indicator weightings to the Morley Farms data also provides valuable pointers to practical ways in which pesticide impact can be reduced through changes in individual crop agronomy. Reflecting their effect on non-target species, pyrethroid insecticides used to combat aphids and BYDV attract a higher weighting in the HRI system.
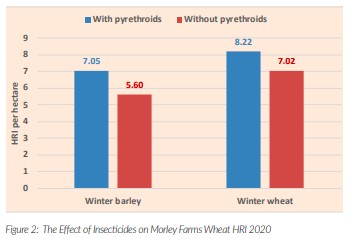
Calculations show that eliminating the single insecticide spray used in winter cereals at Morley in 2020 would have reduced winter cereal HRIs by 15-20% (Figure 2). This underlines the potential value of BYDV tolerant varieties, sowing date adjustments and the use of prediction models.
Regardless of the detail, the most important thing about these metrics is that they provide a simple yet objective and independently defined way of measuring the likely unintended impact from pesticide use which have the potential for stakeholder support and uptake.
Against the background of the growing debate over the future of pesticide use and the limits of any legislation that might govern it, farming needs to take the lead in developing measures like this that are both widely acceptable and usable. It is vital, though, that we don’t wait for the establishment of the means to measure these improvements before implementing the things which we know will work. The concept of additionality (where rewards are targeted only to those who can demonstrate improvements, regardless of the starting point) has the potential to delay the implementation of improvements and should be treated with caution for all Natural Capital accounting. Our impact on biodiversity needs the counting systems to help us balance the books.