By Andrea Basche, Assistant Professor in Cropping Systems, Source: University of Nebraska Extension
With growing interest in cover crops, it is important to understand how cover crops might impact soil fertility for the following cash crop. Nitrogen (N) provided by cover crop biomass may be used in the short-term by the following crop, and in the long-term through improving soil N content and reducing fertilizer input costs. The availability of soil nitrogen is a function of residual soil N (or nitrogen present in the soil) and N mineralized (released by the organic pools in the soil) from previous crop residues. However, environmental and management factors greatly influence cover crop decomposition dynamics, making it a challenge to consistently and accurately predict the amount of N that will become available, or when it will become available, to a subsequent crop.
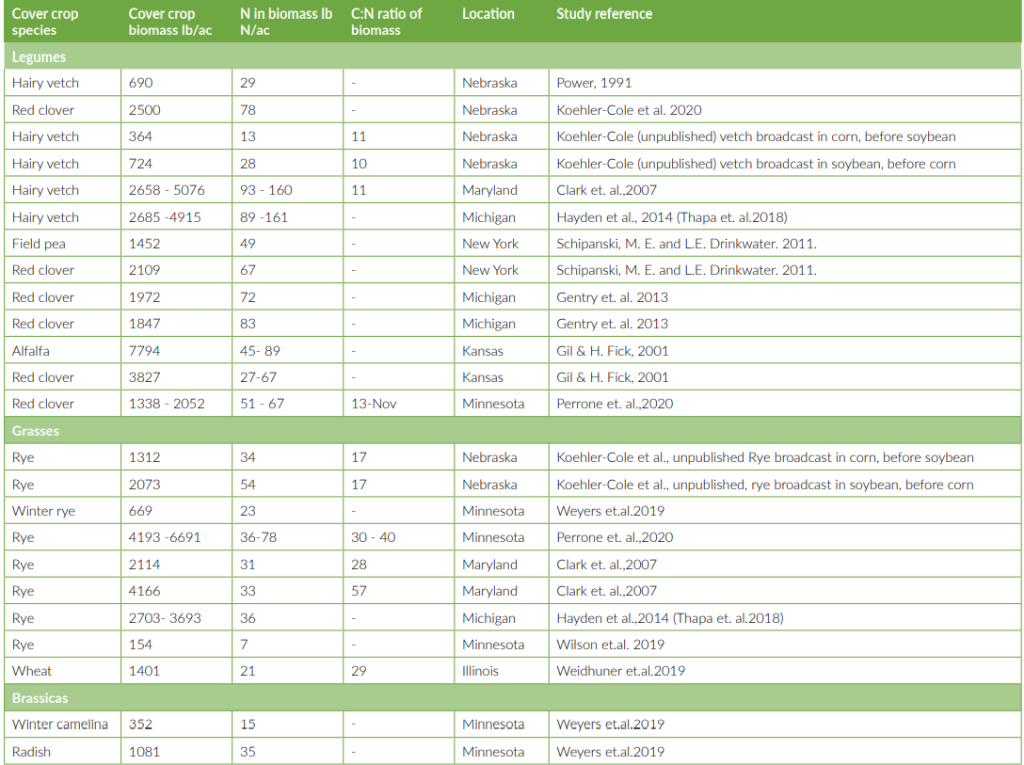
We compiled field studies from Nebraska and other corn-producing states that evaluated the range of biomass production of cover crops, the amount of N in their biomass, and their C:N ratio (Table 1). While these studies do not provide exact estimates of when N is available to subsequent crops, they can give us some information to help inform nutrient changes following cover crops.
Nitrogen Uptake by Legume Versus Grass Cover Crops
Cover crops acquire N through the uptake of nitrate and ammonium from the soil. When cover crops decompose, N is recycled back to the soil. Leguminous cover crops, owing to their symbiosis with rhizobia, can acquire N from the air (biological N fixation). When this N is released during decomposition, it is a net gain of N, so legumes are typically thought of as an N source or supplier. However, not all N in legume biomass is fixed N, as legume may take up considerable amounts of N from the soil (Redfearn, 2016).
The N in clover and vetch varieties commonly used in annual cropping systems can vary widely (Tonitto & Drinkwater, 2006). Among the studies included in Table 1, Nebraska hairy vetch biomass production was in the lower range with 364 to 724 lb/ac, which contained 12 to 29 lb N/ac. Red clover was more productive with 78 lb N/ac. In the Eastern United States, cover crops, especially hairy vetch, had more biomass and N, probably due to milder and wetter climates.
Winter cereals are commonly used in the Midwest as cover crops because of their winter hardiness and high early-spring biomass production. They are also very effective in taking up mineral N and are ‘scavengers’ for nutrients that have moved to the lower part of the root zone, rescuing nutrients that may otherwise be lost (Bergtold et al., 2017). In Nebraska, rye produced between 1,312 and 2,072 lb/ac of biomass, which contained between 34 and 54 lb N/ac (Table 1).
When Does the Nitrogen From Cover Crop Residue Become Available?
Cover crop N release should be synchronized with N demand of the succeeding crop. The N accumulated in the cover crop biomass will be available to crop absorption after mineralization, which depends on soil moisture and temperature, soil type, and the carbon to nitrogen ratio (C:N ratio) of the biomass (Gil and Fick, 2001). The C:N ratio is the amount of carbon in cover crop biomass divided by the amount of N. It is often used to predict how fast soil microbes will breakdown residue and release residue N back to the soil. Microbes use the carbon in residues for energy and the N for protein (think growth). A C:N ratio of 24:1 is considered “ideal” as it has the balance of carbon to N that soil microbes need. Residues with greater C:N ratios will decompose slower because there is not enough N for microbial growth. To decompose residue with high C:N ratios, microbes take up N from the soil, thus immobilizing or “tying up” N. Residues with C:N ratios lower than 24:1 decompose quickly, and because there is more N than microbes need, N will be available for the next crop (USDA, 2011).
Legumes residues typically have lower C:N ratio (Table 1) and decompose more rapidly than grasses, providing readily available N to the subsequent crop. However, if the subsequent crop cannot take up the N, there is potential for loss. Cereal rye residues often have high C:N ratios and may immobilize soil N. Because of that starter fertilizer is typically recommended to overcome immobilization, with a rate between 30–50 pounds of actual N per acre (Midwest Cover Crop Council, 2019).
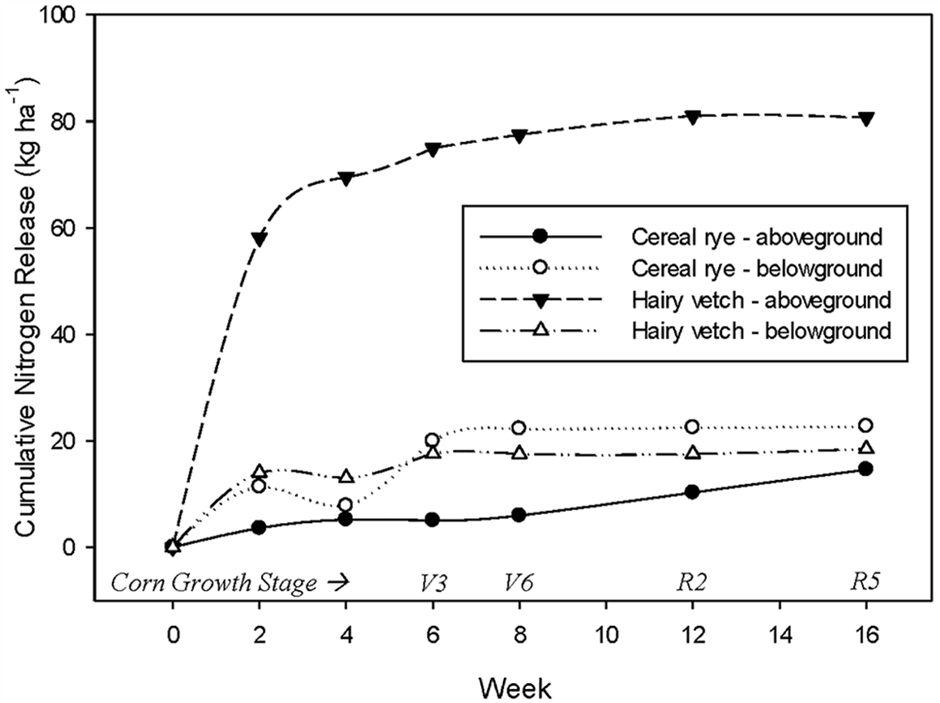
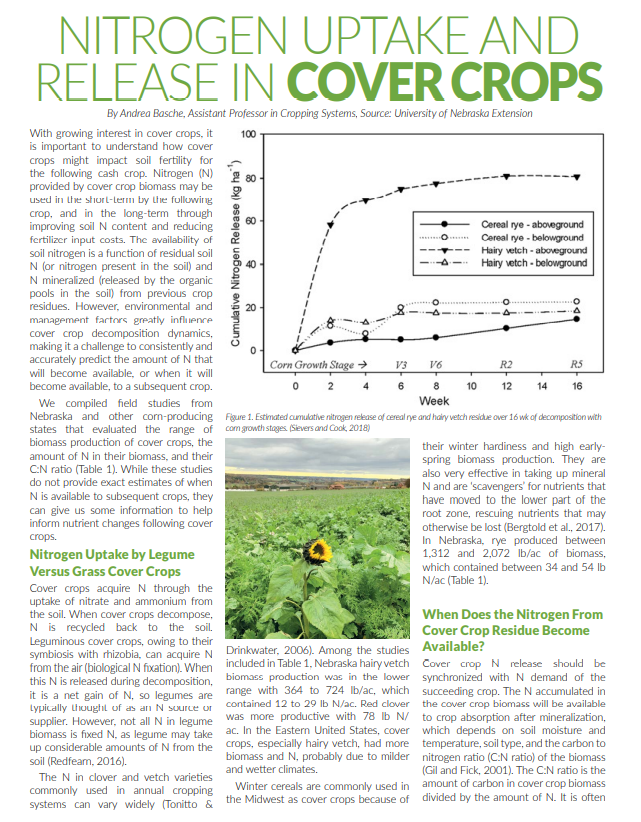
Figure 1. Estimated cumulative nitrogen release of cereal rye and hairy vetch residue over 16 wk of decomposition with corn growth stages. (Sievers and Cook, 2018)
An experiment in 2015 in Carbondale, IL, assessed the time it took for N from a legume (in this case, hairy vetch) and grass cover crop (cereal rye) to be released. Hairy vetch rapidly decomposed and released about 70 lb N/ac within the first 4 weeks after corn planting (Fig. 1). Cereal rye residues released less than 10 lb N/ac during that same period, and overall released much less N (Sievers & Cook, 2018).
Some strategies, such the incorporation of the residues, can result in faster N release. The use of mixes of grasses and legumes can also modify the C:N ratio and speed up decomposition.
The Bottom Line: Consider Your Species, Biomass, and Environmental Conditions
Biomass production, N uptake, and C:N ratio vary widely across the United States, with Nebraska on the lower end of productivity. The N in cover crop biomass will be released within a few weeks after termination, however, decomposition varies with soil moisture, soil temperature and C:N ratios. Therefore, not all biomass N will be available for the subsequent crop. A better understanding of cover crop N release and cash crop N uptake can help to optimize crop synchrony and the choice of species to grow.
Some cover crop species have the potential to produce a high amount of biomass, providing great soil protection and reduce nitrate leaching, but they may not be suitable as an N source for a subsequent crop. Mixing cover crop species can overcome shortfalls of individual species and should be explored in more detail.