This analysis examines export opportunities for UK producers, both ones that exist currently and those that may emerge over the coming decade.
Pinpointing the opportunities
The expansion of the middle classes in emerging markets across the globe is strengthening the demand for protein and imported foods. And globally the British brand is well-regarded, being associated with quality and high safety standards. So how can UK producers and exporters capitalise on these favourable circumstances?
Who is this analysis for?
We aim to help producers and exporters build an understanding of the opportunities and challenges of trading in different world regions. Policymakers and trade negotiators will also find useful the review of economic potential in overseas markets.
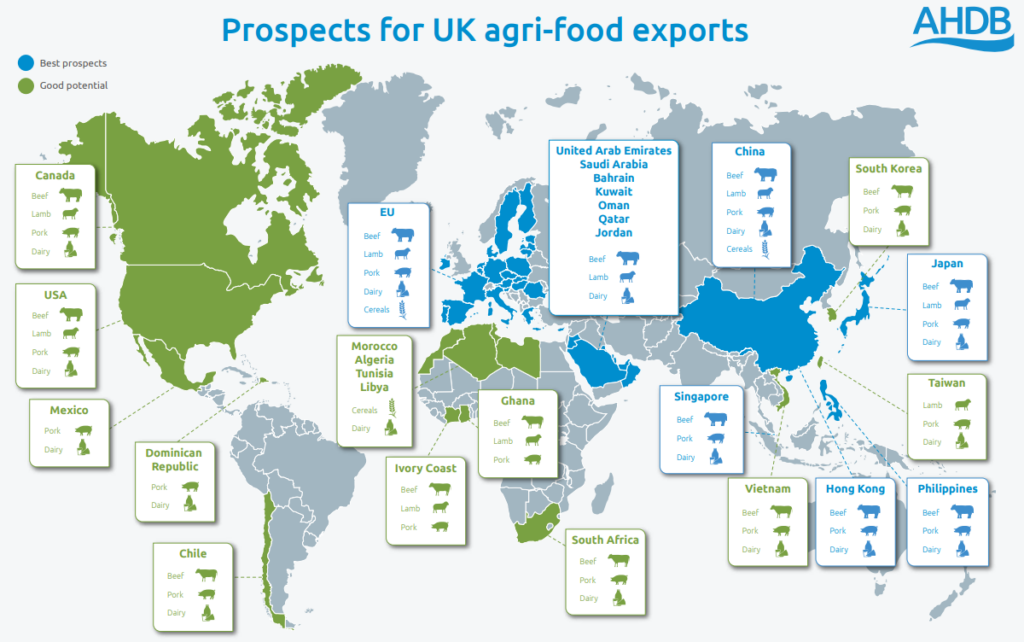
Analysis by world region
Europe: The EU remains one of the UK’s most important trading partners and will continue to be a key opportunity in the future due to the proximity of the market and well-established relationships.
Asia: Asia holds significant potential for UK exports due to its large population, increasing middle-class wealth, rising meat consumption and consumers’ high regard for food safety and quality.
North America: The main opportunity for UK exporters in North America will be for premium red meat and dairy products which are differentiated from domestic production.
Middle East and North Africa (Coming soon): MENA offers significant opportunities for UK exporters, especially for the lamb and dairy sectors due to the region’s strong population growth together with limited production capacity driving food imports higher over the next decade.
Central/South America (Coming soon): There are limited export opportunities for the UK in Central and South America, primarily due to the proximity of the big exporters such as the USA, Brazil and Argentina who are the main suppliers of this market.
Sub-Saharan Africa (Coming soon): There’s room to expand on the amount of commodity level red meat the UK currently exports to Ghana, Cote d’Ivoire and South Africa as well as increasing premium cuts into South Africa.
Where does the UK currently export Cereals to?
The European Union (EU) remains the UK’s most important trading partner. But now the UK is free to strike trade deals with other nations, so it is worth exploring where the most fruitful opportunities lie.
Wheat
- The amount of wheat exported by the UK depends on production in any given year and can vary considerably
- The EU is the most important trading partner for the UK wheat market, with over 90% of UK wheat exports shipped to the trading bloc over the past five years on average
- Domestic production and supplies around the world, particularly those of the UK’s main competitors and the relative competitiveness of UK grain, are all key factors determining the level of exports in any given year
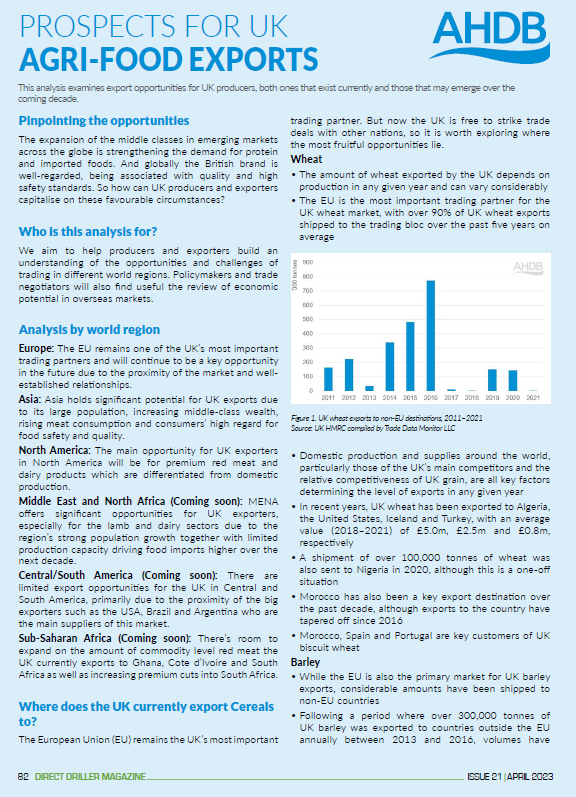
Figure 1. UK wheat exports to non-EU destinations, 2011–2021
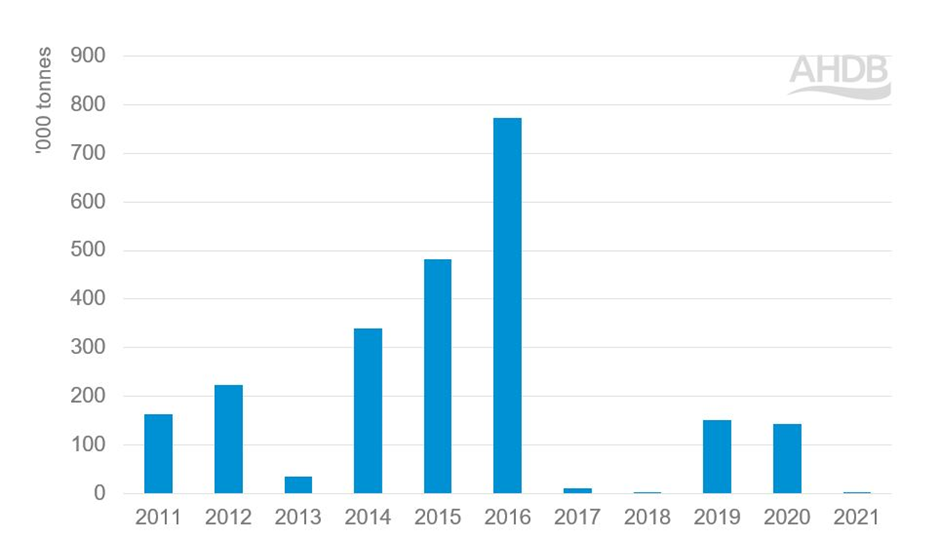
Source: UK HMRC compiled by Trade Data Monitor LLC
- In recent years, UK wheat has been exported to Algeria, the United States, Iceland and Turkey, with an average value (2018–2021) of £5.0m, £2.5m and £0.8m, respectively
- A shipment of over 100,000 tonnes of wheat was also sent to Nigeria in 2020, although this is a one-off situation
- Morocco has also been a key export destination over the past decade, although exports to the country have tapered off since 2016
- Morocco, Spain and Portugal are key customers of UK biscuit wheat
Barley
- While the EU is also the primary market for UK barley exports, considerable amounts have been shipped to non-EU countries
- Following a period where over 300,000 tonnes of UK barley was exported to countries outside the EU annually between 2013 and 2016, volumes have dropped in recent years with the exception of 2020
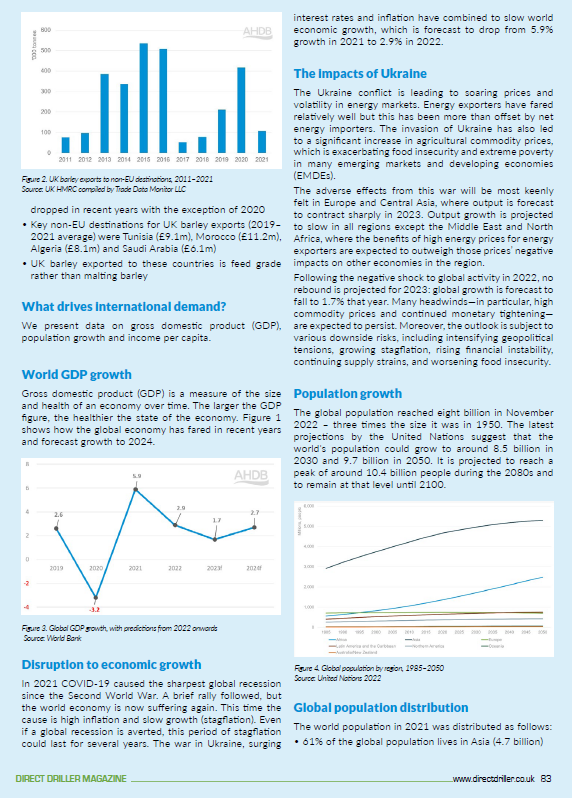
Figure 2. UK barley exports to non-EU destinations, 2011–2021
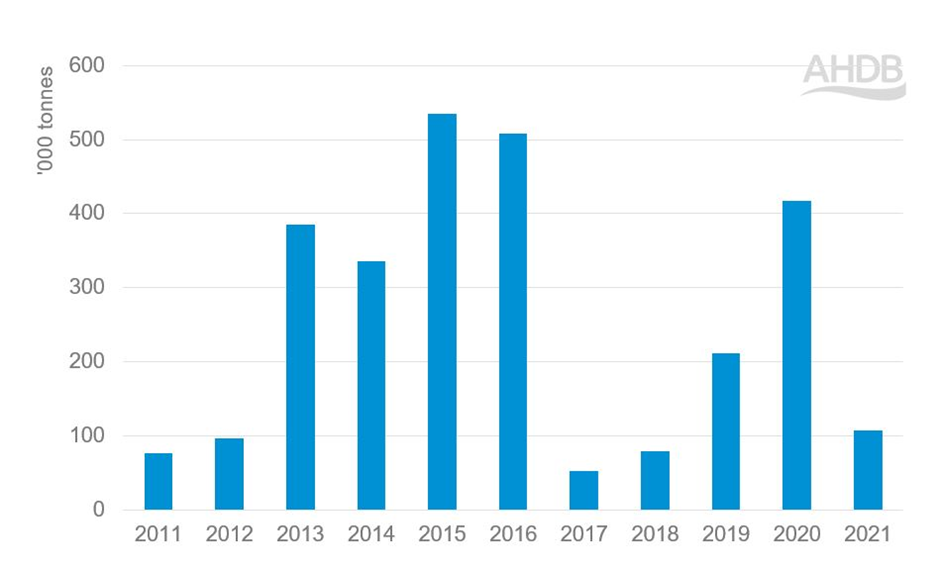
Source: UK HMRC compiled by Trade Data Monitor LLC
- Key non-EU destinations for UK barley exports (2019–2021 average) were Tunisia (£9.1m), Morocco (£11.2m), Algeria (£8.1m) and Saudi Arabia (£6.1m)
- UK barley exported to these countries is feed grade rather than malting barley
What drives international demand?
We present data on gross domestic product (GDP), population growth and income per capita.
World GDP growth
Gross domestic product (GDP) is a measure of the size and health of an economy over time. The larger the GDP figure, the healthier the state of the economy. Figure 1 shows how the global economy has fared in recent years and forecast growth to 2024.
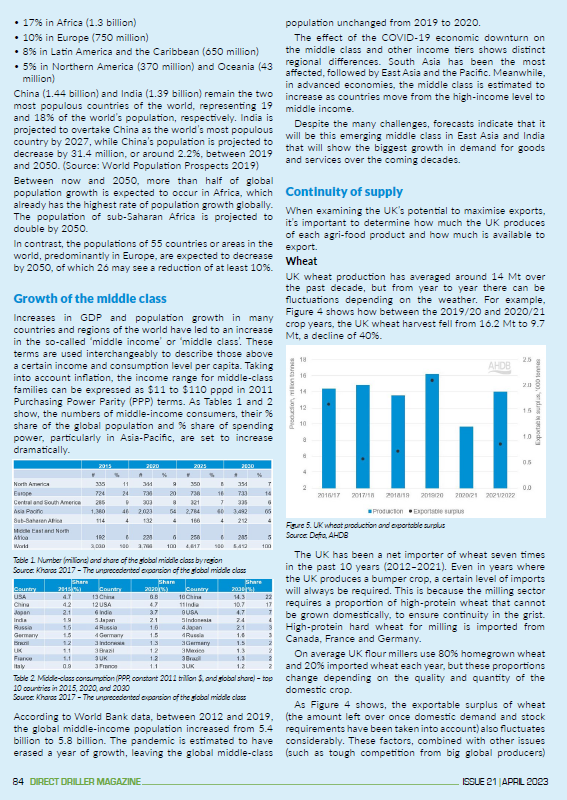
Figure 3. Global GDP growth, with predictions from 2022 onwards
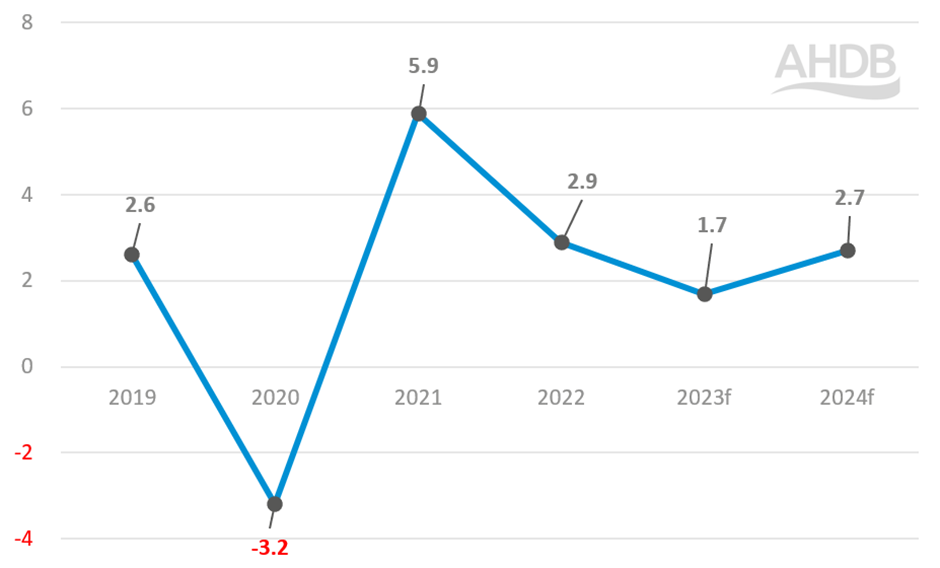
Source: World Bank
Disruption to economic growth
In 2021 COVID-19 caused the sharpest global recession since the Second World War. A brief rally followed, but the world economy is now suffering again. This time the cause is high inflation and slow growth (stagflation). Even if a global recession is averted, this period of stagflation could last for several years. The war in Ukraine, surging interest rates and inflation have combined to slow world economic growth, which is forecast to drop from 5.9% growth in 2021 to 2.9% in 2022.
The impacts of Ukraine
The Ukraine conflict is leading to soaring prices and volatility in energy markets. Energy exporters have fared relatively well but this has been more than offset by net energy importers. The invasion of Ukraine has also led to a significant increase in agricultural commodity prices, which is exacerbating food insecurity and extreme poverty in many emerging markets and developing economies (EMDEs).
The adverse effects from this war will be most keenly felt in Europe and Central Asia, where output is forecast to contract sharply in 2023. Output growth is projected to slow in all regions except the Middle East and North Africa, where the benefits of high energy prices for energy exporters are expected to outweigh those prices’ negative impacts on other economies in the region.
Following the negative shock to global activity in 2022, no rebound is projected for 2023: global growth is forecast to fall to 1.7% that year. Many headwinds—in particular, high commodity prices and continued monetary tightening—are expected to persist. Moreover, the outlook is subject to various downside risks, including intensifying geopolitical tensions, growing stagflation, rising financial instability, continuing supply strains, and worsening food insecurity.
Population growth
The global population reached eight billion in November 2022 – three times the size it was in 1950. The latest projections by the United Nations suggest that the world’s population could grow to around 8.5 billion in 2030 and 9.7 billion in 2050. It is projected to reach a peak of around 10.4 billion people during the 2080s and to remain at that level until 2100.
Figure 4. Global population by region, 1985–2050
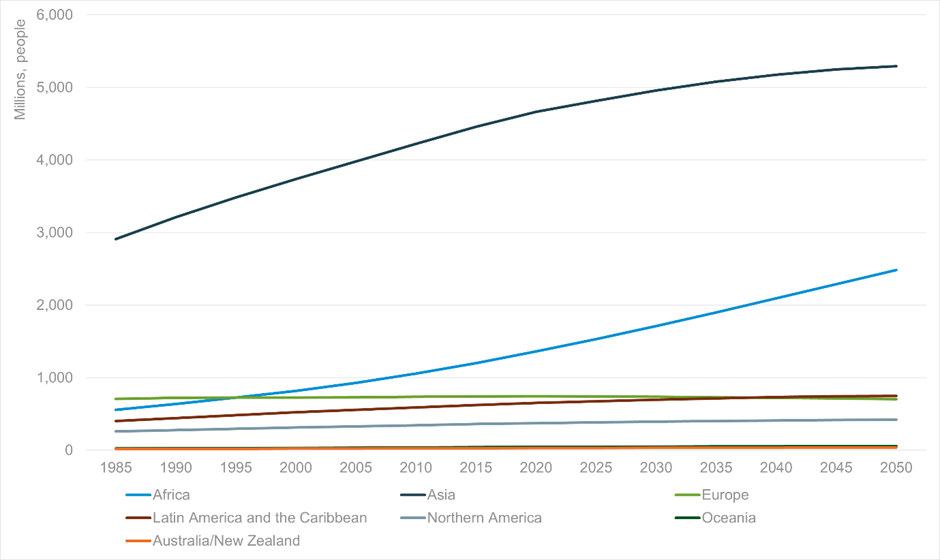
Source: United Nations 2022
Global population distribution
The world population in 2021 was distributed as follows:
- 61% of the global population lives in Asia (4.7 billion)
- 17% in Africa (1.3 billion)
- 10% in Europe (750 million)
- 8% in Latin America and the Caribbean (650 million)
- 5% in Northern America (370 million) and Oceania (43 million)
China (1.44 billion) and India (1.39 billion) remain the two most populous countries of the world, representing 19 and 18% of the world’s population, respectively. India is projected to overtake China as the world’s most populous country by 2027, while China’s population is projected to decrease by 31.4 million, or around 2.2%, between 2019 and 2050. (Source: World Population Prospects 2019)
Between now and 2050, more than half of global population growth is expected to occur in Africa, which already has the highest rate of population growth globally. The population of sub-Saharan Africa is projected to double by 2050.
In contrast, the populations of 55 countries or areas in the world, predominantly in Europe, are expected to decrease by 2050, of which 26 may see a reduction of at least 10%.
Growth of the middle class
Increases in GDP and population growth in many countries and regions of the world have led to an increase in the so-called ‘middle income’ or ‘middle class’. These terms are used interchangeably to describe those above a certain income and consumption level per capita. Taking into account inflation, the income range for middle-class families can be expressed as $11 to $110 pppd in 2011 Purchasing Power Parity (PPP) terms. As Tables 1 and 2 show, the numbers of middle-income consumers, their % share of the global population and % share of spending power, particularly in Asia-Pacific, are set to increase dramatically.
Table 1. Number (millions) and share of the global middle class by region
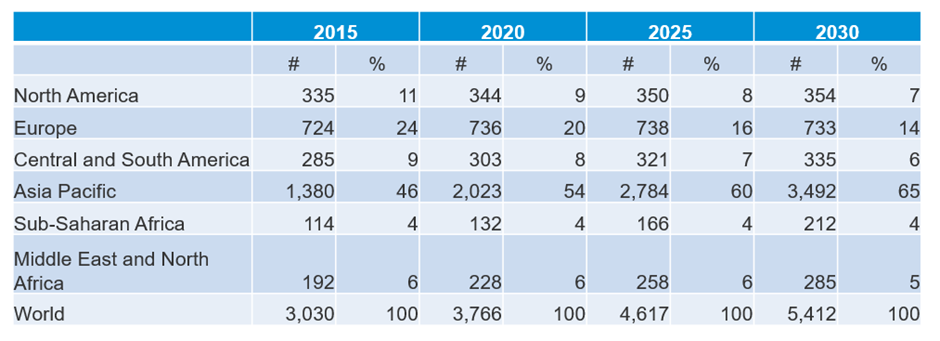
Source: Kharas 2017 – The unprecedented expansion of the global middle class
Table 2. Middle-class consumption (PPP, constant 2011 trillion $, and global share) – top 10 countries in 2015, 2020, and 2030
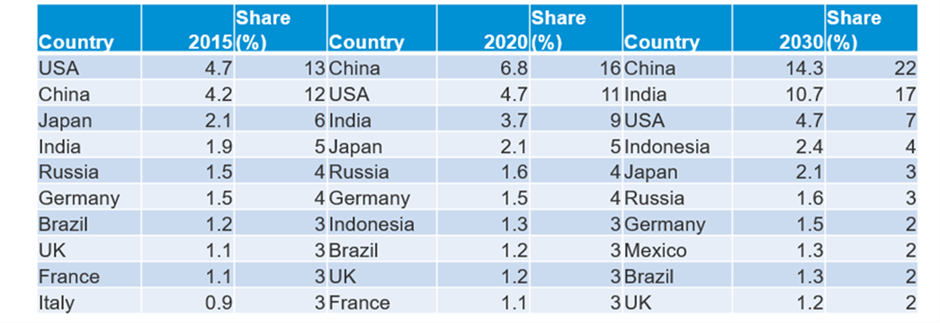
Source: Kharas 2017 – The unprecedented expansion of the global middle class
According to World Bank data, between 2012 and 2019, the global middle-income population increased from 5.4 billion to 5.8 billion. The pandemic is estimated to have erased a year of growth, leaving the global middle-class population unchanged from 2019 to 2020.
The effect of the COVID-19 economic downturn on the middle class and other income tiers shows distinct regional differences. South Asia has been the most affected, followed by East Asia and the Pacific. Meanwhile, in advanced economies, the middle class is estimated to increase as countries move from the high-income level to middle income.
Despite the many challenges, forecasts indicate that it will be this emerging middle class in East Asia and India that will show the biggest growth in demand for goods and services over the coming decades.
Continuity of supply
When examining the UK’s potential to maximise exports, it’s important to determine how much the UK produces of each agri-food product and how much is available to export.
Wheat
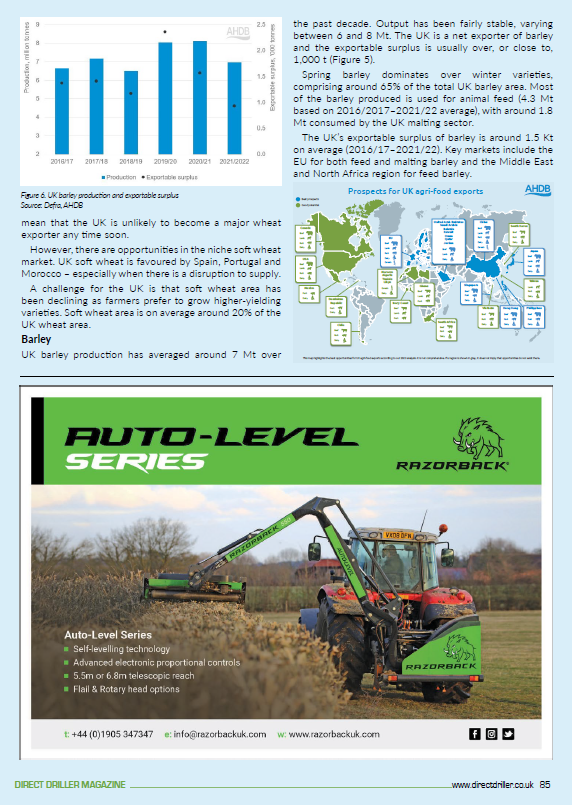
UK wheat production has averaged around 14 Mt over the past decade, but from year to year there can be fluctuations depending on the weather. For example, Figure 4 shows how between the 2019/20 and 2020/21 crop years, the UK wheat harvest fell from 16.2 Mt to 9.7 Mt, a decline of 40%.
The UK has been a net importer of wheat seven times in the past 10 years (2012–2021). Even in years where the UK produces a bumper crop, a certain level of imports will always be required. This is because the milling sector requires a proportion of high-protein wheat that cannot be grown domestically, to ensure continuity in the grist. High-protein hard wheat for milling is imported from Canada, France and Germany.
On average UK flour millers use 80% homegrown wheat and 20% imported wheat each year, but these proportions change depending on the quality and quantity of the domestic crop.
Figure 5. UK wheat production and exportable surplus
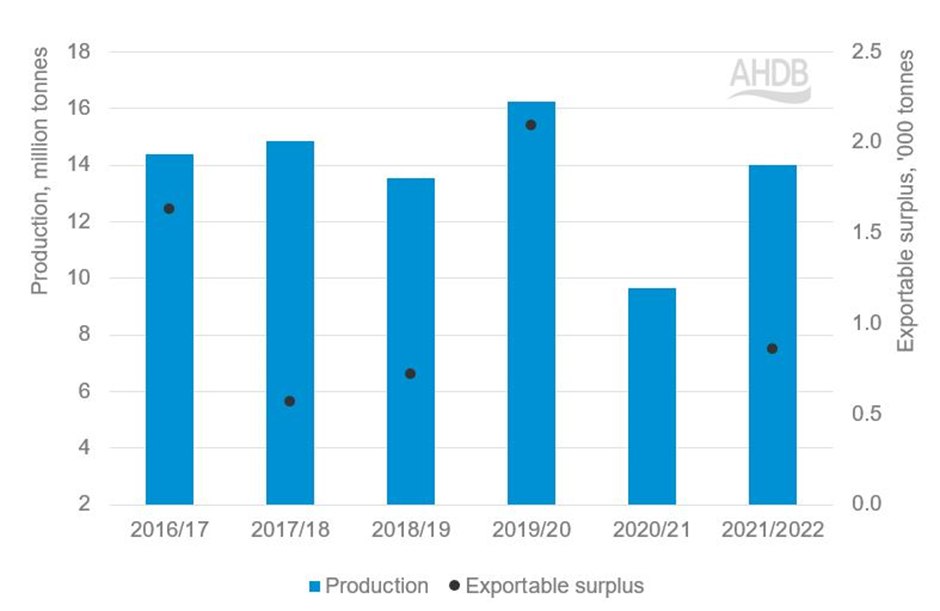
Source: Defra, AHDB
As Figure 4 shows, the exportable surplus of wheat (the amount left over once domestic demand and stock requirements have been taken into account) also fluctuates considerably. These factors, combined with other issues (such as tough competition from big global producers) mean that the UK is unlikely to become a major wheat exporter any time soon.
However, there are opportunities in the niche soft wheat market. UK soft wheat is favoured by Spain, Portugal and Morocco – especially when there is a disruption to supply.
A challenge for the UK is that soft wheat area has been declining as farmers prefer to grow higher-yielding varieties. Soft wheat area is on average around 20% of the UK wheat area.
Barley
UK barley production has averaged around 7 Mt over the past decade. Output has been fairly stable, varying between 6 and 8 Mt. The UK is a net exporter of barley and the exportable surplus is usually over, or close to, 1,000 t (Figure 5).
Figure 6. UK barley production and exportable surplus
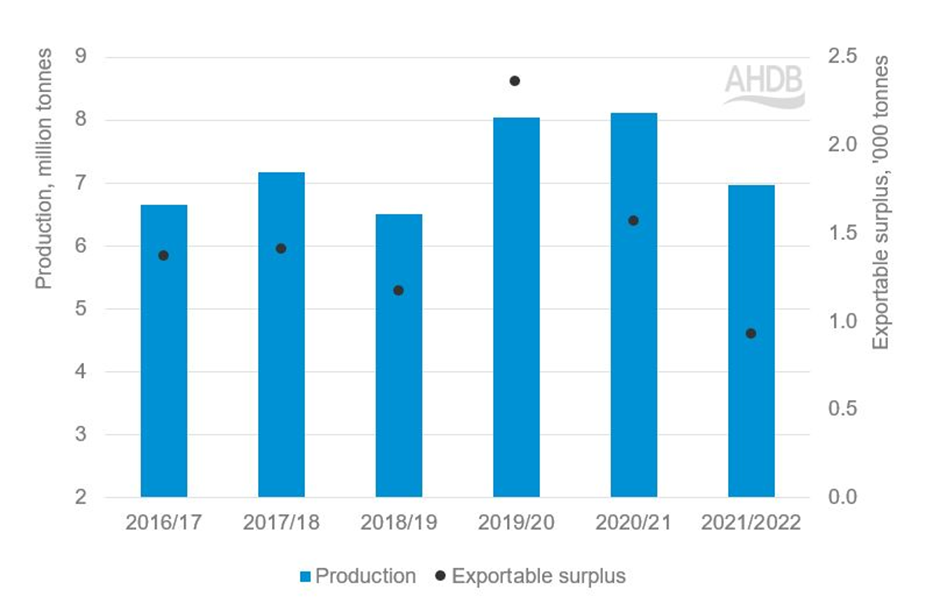
Source: Defra, AHDB
Spring barley dominates over winter varieties, comprising around 65% of the total UK barley area. Most of the barley produced is used for animal feed (4.3 Mt based on 2016/2017–2021/22 average), with around 1.8 Mt consumed by the UK malting sector.
The UK’s exportable surplus of barley is around 1.5 Kt on average (2016/17–2021/22). Key markets include the EU for both feed and malting barley and the Middle East and North Africa region for feed barley.