Authors: Dominic Amos [Researcher] Jerry Alford [Coordinator]
Introduction
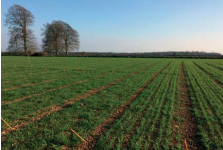
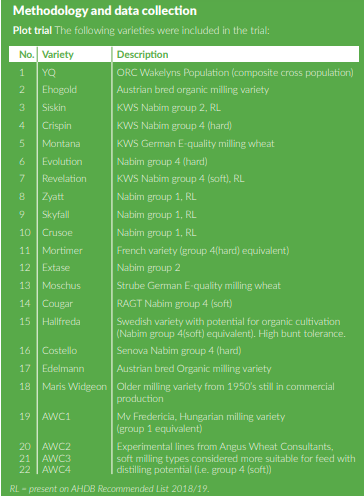
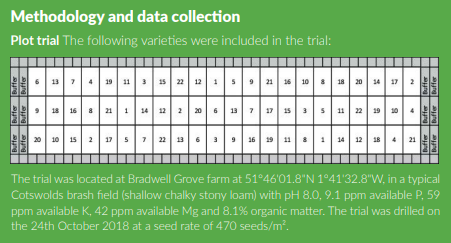
The field lab is focussed on investigating winter wheat variety performance using a single replicated plot trial on an organic farm and larger scale strips in farmers’ fields. The plot trial acts as a reference for comparison of a large number of varieties representing a broad range of genotypes from conventional and organic breeding and from modern and heritage lines. The key point has always been that varieties used in organic farming should be tested and evaluated under organic conditions, providing organic farmers with relevant performance data.
The group consists of organic farmers based in and around the Cotswolds who are interested in comparing varieties and assessing their performance under organic conditions to help make decisions about onfarm varietal choice. This field lab started in 2017/18 with a single plot trial, developing in the second year (2018/19) to a plot trial and farm trials, reported here. The field lab will continue into at third year (2019/20) with the plot trial and further farm trials in a more integrated network as a trial platform for organic variety testing.
Field lab aims
The aim of this field lab is to investigate and compare different wheat varieties and their suitability for organic farming by providing a platform for organic farmers to reasonably compare and evaluate a large number of varieties grown in an environment relevant to them. Specifically, the lab will assess various crop traits of different genotypes (varieties) to explore and understand crop performance and agronomic characteristics for organic farming. The trial will provide information on crop performance to help inform farmers’ decisions on varietal selection.
The lab also aims to contribute to the initiation of a coordinated variety testing platform for organic wheat (with potential extensions to other species) with testing at both plot scale and on-farm at field scale.
Background
Despite the increasing concern about the limited relevance of recommended lists (RL) originating from conventionally managed trials, there is no established central platform for variety trials under organic conditions. There is also concern that organic winter wheat does not consistently meet quantitative and qualitative expectations. Having been bred in, and for, conventional high input farming, non-adapted varieties are probably one of the main drivers of organic wheat under-performance (Murphy et al. 2007). It has also been demonstrated that breeding programs focusing on cultivar evaluation in highinput environments do not result in the selection of cultivars suited to low-input environments (Loyce et al. 2008).
The only recent publicly available varietal information is from conventional trials using full fertiliser and herbicide inputs with the untreated fungicide results the only indication of organic suitability. Organic farmers need better, more reliable information on varietal performance under organic husbandry and therefore need testing to take place under these conditions for the information to be of most relevance.
Plot trials remain the most reliable and simplest way of comparing a large number of varieties in a robust replicated design. However, there is also evidence that under organic conditions the increased e n v i r o n m e n t a l variation means that the most relevant information on yield and quality performance will come from field scale, commercial production on farm. Therefore, the plot trial must be used in conjunction with farm field scale trials (Kravchencko et al. 2016). Testing a restricted number of varieties at a field scale with a network of farmers, allowing for the effects of farm management, whilst maintaining a reference plot trial is a robust method from which to draw conclusions about varietal performance in organic systems.
Samplings and assessments
• Pre-trial soil texture, chemical analysis (N P K Mg pH) and Organic Matter A representative soil sample was collected from the trial area at drilling.
• Crop establishment – visual assessment to detect any differences in germination and early crop vigour. A simple visual assessment took place for each plot to determine crop establishment and make varietal comparisons if differences evident.
• Growth cycle length – crop phenological stage in correspondence of stem extension and late flowering/milk stage The growth stage of each variety was assessed using the BBCH scale at two site visits at stem extension (BBCH 31) and around milk stage (BBC75) to determine earlier or later varieties.
• Crop canopy height – on a plot basis, in correspondence of stem extension and flowering. The canopy height was measured using a ruler to give a representative canopy height across the plot.
• Crop and Weed cover – on a plot basis, at stem extension and flowering A simple visual assessment of crop and weed ground cover % was taken at these key times.
• Relative Crop Biomass – on a plot basis, at stem extension. A simple visual assessment of crop biomass relative to the highest biomass variety (Maris Widgeon) set to 100%. i.e. a variety with half the biomass of Maris W would score 50%, and variety with 3/4 the biomass would score 75%.
• Crop Growth Habit – on a plot basis at stem extension. A simple 1 to 5 scale from prostrate to erect to give an idea of crop morphology and canopy structure at this timing.
• Disease severity – on a plot basis. Identification of main foliar diseases and estimated average percentage cover of flag leaf and 2nd leaf in correspondence of BBCH GS 65
A simple percentage leaf area showing symptoms for the two leaves described was performed
• Ear density – count of fertile tillers on two randomly selected quadrats in each plot Counts of ears in a 0.25m2 quadrat to provide an estimate of ear numbers per meter squared.
• Farmer voting – Farmers vote on favourite variety according to observed crop traits in the field. Farmers voting for favourite varieties based on observed crop traits, beneficial for crop production on their farms. Voting to be held around stem extension and late flowering.
• Grain yield – plot combine harvest of each plot at maturity, with grain weight adjusted at 15% moisture and converted to t/ha. Each plot harvested to provide a t/ha grain yield and a moisture content to allow standardisation to 15% moisture.
• Grain quality – protein content and specific weight (hectolitre weight, HLW), and Hagberg Falling Number (HFN) measured in a lab by AWC Ltd.
Samples collected at harvest and analysed for each variety on a single bulked sample made up from all three plots.
3.2 Farm field scale trials
In addition to the plot trials three farmers selected three varieties (the farm variety that they commonly grow and two additional new varieties) to test at a field scale using commercial farm equipment. The varieties were drilled side by side in the same field as large strips of equal size. These strips were harvested and combine yield data provided by the farmers. Grain samples were sent for quality testing of protein, HLW and HFN. This testing provided each farmer with a direct and reliable comparison of varieties under their own farm conditions to compliment and compare with the plot trial results.
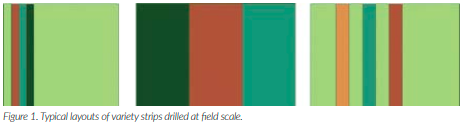
Examples of how the farmers laid out their variety strips in the field are illustrated below. The farmers drilled and harvested the strips and managed the varieties according to their own best farm practice:
3.3 Data analysis
The trial was designed as a randomised complete block, with 22 “treatments” and three replicates.. Data was analysed by a linear model to highlight effect of variety over any response variable. Validity of the model was checked graphically observing the diagnostic plot of residuals (quantilequantile plot). Pairwise comparisons between varieties was carried out through the Tukey’s HSD test. To visualise relationships between the tested variables, principal component analysis (PCA) was run in two steps. First, an interim PCA was run with all the variables included, and the quality of representation (Cos2) of each variable was checked. Second, a definitive PCA was run with those variables with a quality of representation higher than 0.5. The package ‘emmeans’ was used to calculate estimated marginal means. All analyses were done by R version 3.6.1.
Results to be reported in Issue 10 of Direct Driller Magazine