The AHDB Monitor Farm network have run a Labour & Machinery review on over 20 farms stretching the length and breadth of the UK, here AHDB’s Harry Henderson shines a light on the findings.
Across the AHDB Monitor Farm network, with the help of Strutt & Parker we have run a Labour & Machinery review on over 20 farms stretching from Morayshire in the north of Scotland to Truro some 700 miles to the south. At each Monitor Farm meeting on these farms, we have discussed the Monitor Farmers costs, and given the attendees a way of quickly calculating their own costs, so they can easily see if costs are in the ballpark or heading upwards, with no change in farm output to support the uplift.
It could be easy to assume that there are a set of numbers each farm must get close to, to achieve good business results. We have all heard statements like getting below 1.5HP/ ha, farming more than 300 hectares, employing 1 person per 1000 hectares are benchmarks every farm should work towards. The reality of course, it is not that simple. Each farm business has different objectives and attitude to risk, lifestyle and yes, vanity comes into it too.

There is nothing wrong running the business however you like, so long as the machinery policy is sustainable, affordable and able to weather the unknown years ahead. So understanding your costs is vital and reducing soil movement costs could be seen as low hanging fruit.

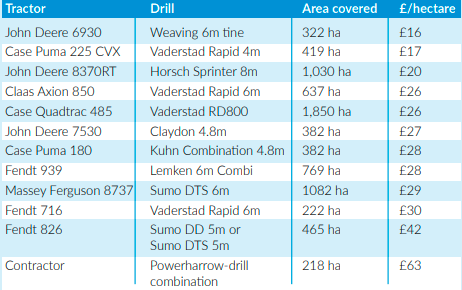
Looking at crop establishment costs in particular, from a full Lemken plough and 6 meter mounted powerharrow drill combination through to a onepass Sumo DD, and most machines in between, where costed out in the same format the costs of drilling one hectare of land ranged from £16 to £63. Of course, in most situations, it’s the work carried out ahead of the drilling operation that matters, how many times have you seen a min-till drill working in a seedbed a Massey 30 drill could cope with? So was it a Massey 30 costing just £16/ha to use, and what is costing £63?
It goes without saying, there is a whole other story behind each of these drill set-ups in terms of pre-cultivations and little can drawn upon these figures alone. Having said that, the farm that runs a strip-till drill and/or a notill drill could be seen as able to draw on technology for any soil condition and still comes in costing below a contracting charge for a powerharrow combination. That makes you think.

If you were wondering, the Massey Ferguson 30 4meter drill, pulled by a David Brown 1494 Hydrashift covering 55 hectares last year cost just £7/ha to operate, using family labour. The stand out point here is that depreciation is nil. The issue might come when you give this rig 200 hectares to do, running the risk of break downs and missed drilling windows, adding costs in another way.
At the AHDB Monitor Farm meetings, we have been using a simple paper based calculator to give a quick calculation of machine costs. It’s better than a back-of-an-envelope calculation but if you need to consider downtime (rainy days) of farm staff, more accurate fuel calculations and depreciation based on machine replacement value then that falls outside the scope of this calculator. But as a quick guide, it’s good enough.

Search ‘AHDB machinery cost calculator’ on-line and it will pop up. Or visit: cereals.ahdb.org.uk/tools/ machinery-cost-calculator.
It is also important to understand that low tractor costs per hour may not be the best target. A John Deere 8530 in Yorkshire pulls a 4m strip-till drill and nothing else. Totalling just 200 to 250 hours a year it would be easy to assume the tractor is underutilised and should be sold with a hire tractor brought in each year. But the total yearly costs of the 8530 are half that of a suitable tractor hired in at peak season. A comfortable, reliable tractor with RTK, the Deere will remain on farm for the foreseeable future.
What are the top tips from this review?
Drawing comparisons across all the Monitor Farms you soon see just how different businesses really are, but here are six
top machinery policy tips from the top 25% of performers;
1. Low depreciation costs per hectare. Depreciation is the largest cost in running a machine at 33%, followed by fuel at 26%. There is a positive correlation between depreciation costs and the overall operation costs; all of the top 25% achieved low operational costs with machine depreciation costs below the average of £63 /ha. This was achieved either through simply operating over a large area (those with a low HP/cropped ha). Where this was not possible, low depreciation costs were also achieved either where the machines were kept for longer (beyond 7 years) or residual values kept high through regular maintenance.
2. Low repair costs per hectare. Low repair costs were not exclusive to farms running newer equipment. Farms with older machinery still achieved low repair costs through tactical hiring of key equipment (eg. the combine), or through employing experienced staff who could carry out basic maintenance and repair work on the machines. The adoption of a prolonged replacement policy should be evaluated on a machine-by-machine basis, identifying those which can be easily repaired/serviced and for which reliability is not paramount. 3. Low diesel usage per hectare. As fuel is the second largest cost of running a machine (26%), the top 25% were all using less than 100 litres of gas oil per cropped hectare on average.
4. Low machine costs per hour. The top 25% had hourly machine costs for their main operational tractors (e.g. drilling tractor) ranging from £17 /hr to £24 /hr (for 190-250 HP tractors). The low hourly cost of running a tractor created savings in the key operational costs such as drilling. Whilst low machine costs per hour are linked to depreciation, they were also achieved by farms carrying out contract work, or farms with non-arable enterprises which utilise the annual ownership of the machine.
5. Low cost of combining per hectare. Combining is the most expensive operation applied to a crop at £66/ha on average. The top 25% were generally covering more hectares per metre of combine header than the rest at 70ha on average. A 10m header was therefore cutting at least 700 ha. The cheapest cost of combining (£41/ha) was achieved by a 7.3m combine cutting 569 ha (78 ha per m of cutter bar). This machine was also contract hired, and hence had no repair costs associated with it. The average area cut by an individual combine was 545 ha. Interestingly, the most utilised combine (121 ha per m of cutter bar) still had an above average cost per hectare. This particular machine was hampered by small fields, averaging just 10 hectares each. Some Monitor Farms had a combining cost greater than £87/ha, the same as the average NAAC contractors charge rate. Marginal savings from using a contractor may however be outweighed by logistical and timing inconvenience.
6. Size. Whilst there was no clear correlation between size and costs, the top 25% ranged in size from 500 ha to 1,000 ha in cropped area. Economies of scale prevented some of the smaller farms (under 350 ha) from obtaining the lowest cost wheat production. Conversely, some of the largest farms had the highest costs.
To learn more or join a Monitor Farm meeting, visit: cereals.ahdb.org.uk/monitorfarms
