Results and Discussions – Spring Assessments
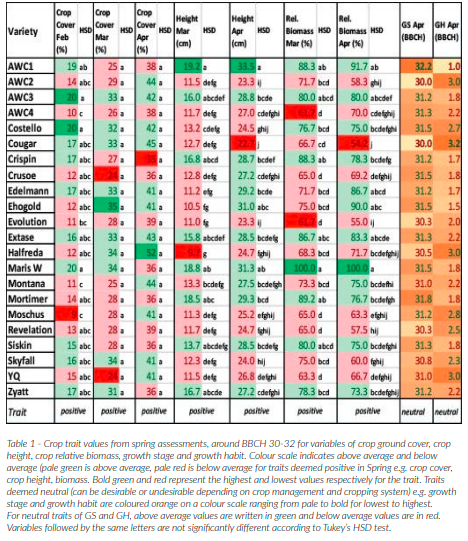
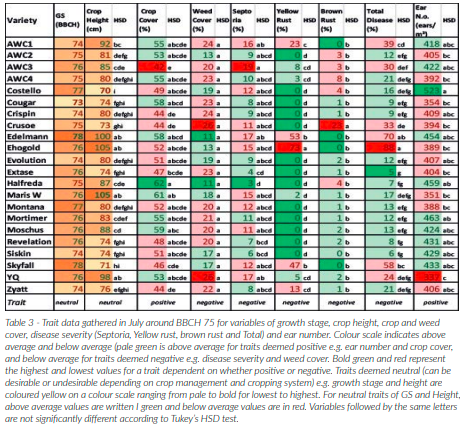
The above table shows different crop traits that can be easily measured around stem extension, a key growth stage signalling the end of the Foundation Phase and the start of the Construction Phase. Several of the traits relate to crop vigour in the spring, which is desirable for organic farming, offering greater competition from the crop against weeds and for resource capture.
Extase and AWC3 showed consistently above average positive spring traits, whilst Evolution performed consistently below average across these traits. Many other traits contribute to yield and quality and it should be noted that despite it’s apparent deficiency in terms of spring vigour, Evolution was the highest yielding variety in the plot trial.
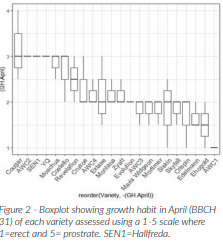
Growth Habit
A relatively simple assessment to perform, varieties can be classed according to five growth habit groups from 1 (erect) to 5 (prostrate). This trait may have implications for the crop management as shown below in the farmer rankings with different weeding strategies dependent on certain growth habits e.g. erect types may be better for inter row hoeing. The trait may also provide an indication of competitiveness, with erect types generally taller and the prostrate types generally providing greater groundcover. Which of these traits may be most useful will depend on a number of factors including the farm (soil, weed community etc.) and the year.
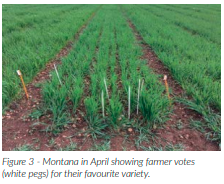
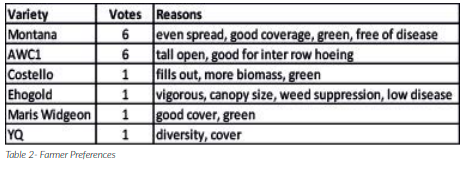
At a field lab meeting in April, farmers were given the opportunity to vote for their favourite variety based on the phenotypes in front of them. Most of the farmers expressed a preference for varieties with high biomass and good groundcover. Montana and AWC1 (Mv Fredericia) were voted the best varieties though for different traits. Montana was selected for its good ground cover, greenness, even spread and moderate height while AWC1 was selected for being tall and open making it suitable for inter row hoeing. This result illustrates the difficulty in selecting a one size fits all variety or so called ideotype for organic farming. The farm and crop management will heavily influence which variety is best suited for that system.
Late flowering/Early milk Assessments in July
Key traits measured in July around late flowering/early milk give an indication of varieties with mostly positive attributes for example disease resistance for the three main foliar diseases, good crop cover and high ear numbers. While ear density is usually the most important of the three yield components, it is not strongly linked with yield here, with grain number per ear and individual grain weight (size) also important. Some varieties with a large number of ears also had rather small ears (i.e. lower grain numbers per ear) and smaller grain. Crop height is generally regarded as an important trait in organic production with taller crops usually deemed desirable for their additional weed smothering and competitiveness.
Of course, crop canopy and cover are also important and height in and of itself may not always be beneficial if the canopy is also very open allowing weeds to compete. For this reason, final height has been treated as a neutral trait particularly given farmers comments about lodging and certain mechanical weeding practices (e.g. weed surfing) that may put taller crops at a disadvantage, or at least make them less desirable. On highly fertile ground taller crops may lodge with associated reductions in yield and grain quality possible. However, in certain circumstances where there is a large and competitive weed community, taller crops can be the difference between satisfactory and very poor yields.
Disease
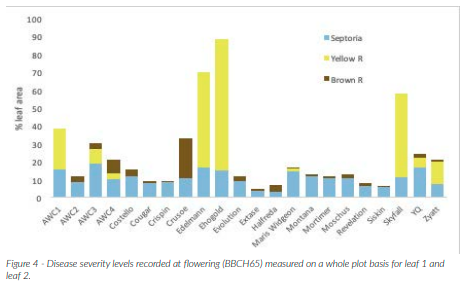
The chart above shows the mean disease severity for the three most important foliar diseases. While disease is often considered by organic arable farmers to be of less importance than either nitrogen and/or weeds in terms of yield limiting, all things being equal, varieties with higher disease resistance will always be desirable. Increased nitrogen availability in conventional trials limits the relevance of so called “untreated” data as there is a known link between nitrogen and disease susceptibility, particularly for Septoria (Loyce et al 2008). Having said that, untreated yields and the relative yield compared to control varieties, used by the RL can be a useful indicator of overall disease tolerance or resistance, with those untreated varieties showing the lowest relative yield reduction compared to treated controls likely to be suitable for organic production. In fact, the best performing varieties in terms of yield also tended to show the lowest mean disease severity e.g. Crispin, Siskin, Evolution, Revelation, Hallfreda.
Varieties with high relative untreated yields on the Recommended List will have high disease resistance and are likely to be highly desirable for organic farming though this data comes from the testing regime for the RL with full fertiliser and herbicide inputs, offering only limited relevance to organic farmers. What is clear is that having a high relative untreated yield is not enough for varieties since they must have a high relative treated yield in order to be considered for the RL.
This means that varieties that show a promising relative untreated yield, and therefore potential suitability for organic farming, can be rejected on the basis that yields are not high enough compared to control varieties under treated (with fungicide), high input conditions. This is clearly an issue for the organic sector with the variety Mortimer offering evidence of this bias. Mortimer has performed consistently well in the organic plot trials for the last two years showing good disease resistance and high yields and has shown promise in terms of its untreated relative yields in NL trials. However, due to its below target treated relative yields the variety has fallen from commercial production despite it’s high disease resistance scores and potential for organic farming.
An argument could be made for a small additional RL that only required high relative untreated yields for varieties to qualify as this would keep additional disease tolerant varieties in circulation and would increase the amount of relevant data for Organic farmers and for those farmers looking to decrease chemical inputs. At present, very disease resistant varieties can easily fall away without showing high fungicide treated yields and the RL is therefore facilitating this loss of naturally disease resistant material. This idea could be taken a stage further to include untreated in terms of nitrogen fertiliser to provide relative yields that would give an indication of those varieties better able to access soil nitrogen.
The 2018/19 season was a challenging one for yellow rust with the two varieties Ehogold and Edelmann were found to be particularly susceptible (Table 3). Severe yellow rust on these two varieties badly affected grain fill and led to a poor yield performance. Both these varieties are organically bred and were included to compare their performance against conventionally bred material given that organically bred materially may show greater adaptation to organic cultivation, given its selection under organic conditions.
However, these varieties were imported from Austria and show that continental varieties can be susceptible to UK races of rust and these varieties must be well tested to confirm resistance in the target production environment before bringing into commercial production in the UK. That said, the conditions were perfect for yellow rust with a mild winter, followed by a warm spring and overnight dews leading to an epidemic. During 2019 higher than expected levels of yellow and brown rust were seen in some varieties. It is not yet clear if the reported cases of high yellow and brown rust disease levels in 2019 indicate the initial emergence of new rust races or exceptionally high disease pressure at some sites due to optimal environmental conditions.
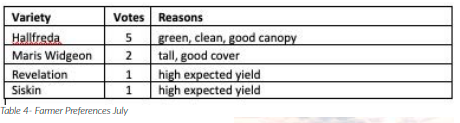
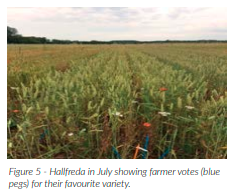
Voting for preferred varieties at a trial meeting in July allowed farmers the opportunity to pick varieties based on a different set of traits and selection criteria than at the meeting in April. Varieties showing good canopy cover, a high green leaf area, low disease levels and a high expected yield (based on ear number and size) were most desirable. Hallfreda, the near market line from Sweden was the winner, mostly thanks to it’s very green and clean appearance and good canopy cover due to its high levels of disease resistance and later maturity.
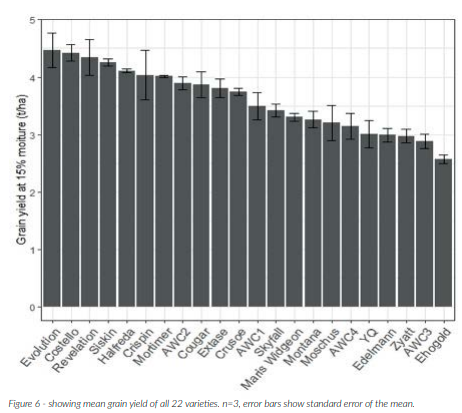
Yield and Quality data
The average yield of the plot trial in 2018/19 was 3.60±0.08 t/ha. Whilst Tukey’s HSD scores show very few varieties are significantly different from each other in terms of yield (see Table 5), the varieties do tend to fall into a below average yielding generally higher quality group (particularly with respect to protein) and an above average yielding generally lower quality group otherwise summarised as a genetic yield (Y) and quality (Q) cluster. Yield and Protein show the typical inverse relationship.
The two groups are generally considered as wheats for milling (Q) and wheats for feed (Y). Looking at Table 5 can help show varieties that may buck the trend such as AWC1 (Mv Fredericia) that comes top of the below average yielding Q group whilst showing high quality for all three variables measured. Hagberg Falling Number (HFN) is a standard measurement for milling quality but is highly linked to crop phenology and ripening making it an awkward variable to include given that the logistics of a plot trial mean all varieties must be harvested together.
This means, that earlier ripening varieties will have a bias against them as they will likely come to maturity several days before the trial is harvested. While still useful as an indicator of quality, this fact should be considered when comparing HFN data. Ehogold illustrates this point well as the earliest ripening of the varieties tested and with high bread making quality attributes, it had one of the lowest HFN numbers.
Investigation of Traits
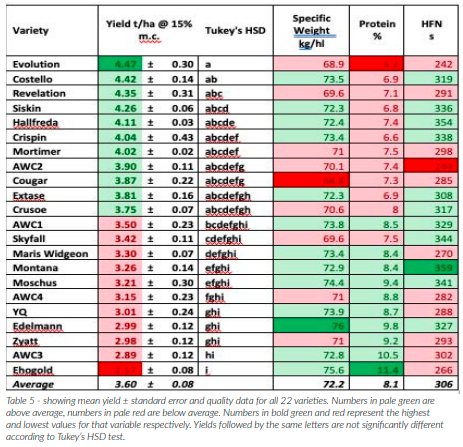
Figure 7 shows the principle components that explain the most variation in the dataset from the 20 varieties (excluding Ehogold and Edelmanm) and the 3 replicates assessed (60 plots) based on all measured traits. These principle components correlate with certain traits which are plotted on the figure and the strength of the correlation indicated by the colour (contrib: red = high and blue = low).
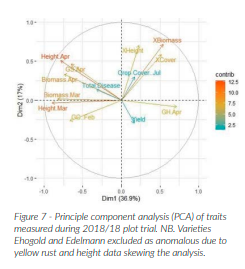
Of all the traits measured the height in March and April, and the relative biomass and the change in relative biomass (the difference between biomass in March and April: XBiomass) are the variables most strongly correlated with PC1. These may be considered a measure of spring vigour. Height in March and biomass in March also strongly influence PC1 while growth habit in April (GH April) also influences PC1. PC2 most strongly correlates with the change in biomass (XBiomass) and the change in height (XHeight). Variables in blue (i.e. yield, crop cover in July and Total disease) have a weaker influence on the principle components. Note that some variables have been excluded entirely from the PCA given their very weak influence on principle components.
We can also look at how the different traits correlate with one another, by looking at the angles between the trait vectors. The smaller the angle the more positively correlated while the larger the angle the more negatively correlated.
Trait vectors at 90 degrees are unlikely to be correlated. Observing the above PCA shows that yield doesn’t appear to be strongly correlated with any traits. The only trait that comes close is the growth habit measured in April with a small suggestion that more prostrate growth habit may be linked with a higher yield, but this is a very weak correlation and can essentially be disregarded. Yield is negatively correlated with total disease, growth stage in April (GS.April) i.e. more forward varieties, and height in April (which will in part be influenced by phenology, since the earlier varieties will be further through stem extension and hence taller). The varieties with more biomass in April also appear to be negatively correlated with yield.
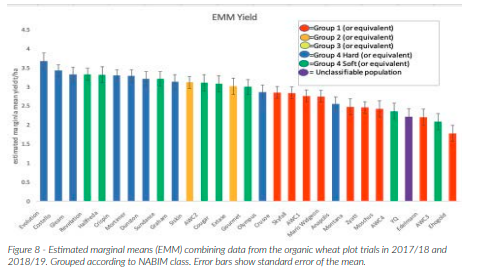
2017/18 and 2018/19 Variety Yield
Estimated marginal means correct for bias due to differences between year to provide a more accurate aggregated mean yield for each variety to enable comparison of varieties averaged across years when certain varieties appeared in only one of the years. The 2017/18 trial yielded a grand average of 2.3t/ ha compared to the grand average of 2018/19 of 3.6t/ha. This represents a yield in 2017/18 of 64% the yield of 2018/19.
This approach has been useful in identifying varieties potentially unsuitable and hence worth dropping from the variety trial. For example, Anapolis as a group 4 falls outside the clustering of the rest of the group 4s that are higher yielding, and falls within the lower yielding, higher quality cluster of the group 1s. Similarly, new group 1 equivalent milling varieties like Ehogold and Edelman don’t appear to offer more productivity than the current collection of group 1 varieties including Crusoe and Skyfall. AWC1 (Mv Fredericia) does look to have potential for organic production after two years with good productivity and excellent quality. The varieties Mortimer and Hallfreda as hard and soft group 4 equivalents respectively also look to have good potential for organic production on a commercial scale, showing good productivity within the cluster of high yielding group 4 types.
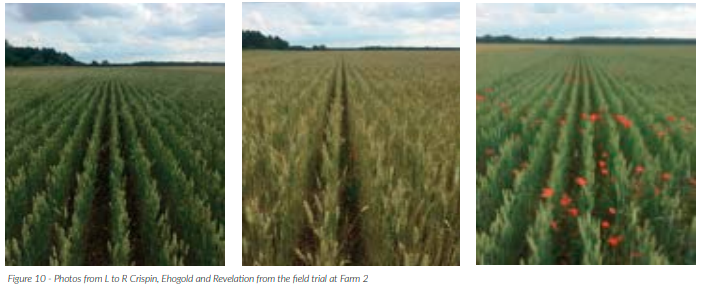
Individual site findings; The Farm field scale trials
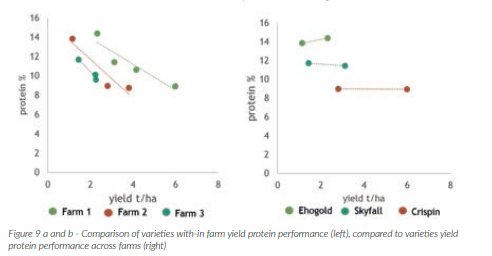
The three farms that each grew a selection of three to four varieties for comparison at a field scale, did so utilising farm management practices to give a more reliable estimate of commercial performance. This was linked with a wider varietal testing network supported by the LIVESEED project. When looking at the varieties grown in each individual farm, these tended to align along a yieldprotein trade-off. However, observing any individual variety across farms, there is an evident change in yield with a reasonably constant protein content.
Thus, the yield protein trade-off, generally seen as a big limitation especially for organic production, does appear across varieties within an individual farm, but not necessarily within a variety across farms (Graph 9 b). These trends are being analysed across the wider Liveseed farm network, hoping to shed light on optimal environments and management systems to help maximise wheat yield and quality. These results could help organic farmers plan their target market and hence varietal selection more effectively to meet market specifications, with some of the highest yielding farms in the wider farm network able to achieve >12% protein content, a particular challenge for organic winter wheat production.