How UK farmers are drowning in test results from different tools and labs, and what happens when you finally bring it all together.
There’s a quiet irony at the heart of modern soil management. Farmers have never had access to more data about their land. Soil chemistry tests, leaf tissue analysis, plant sap readings, nitrate sensors, satellite imagery: the menu of diagnostic technologies keeps growing. And yet, when it comes to making a fertilisation decision in March, most farmers are still relying on a phone call with their agronomist and a gut feeling about what worked last year.
The problem isn’t a lack of data. It’s that none of it is connected. Lab results don’t talk to each other across labs. But they also don’t talk to your field observations, your fertiliser applications, your management practices or your weather data. If you want to understand whether something worked, whether that cover crop improved biology, whether the gypsum moved your calcium, whether the dry spring explains the potassium drop, you need all those dots connected. And right now, they live in completely separate systems.
The filing cabinet problem
Consider a typical progressive arable farmer in the UK. Over the past three seasons, they might have standard soil tests from one lab, Albrecht-method analyses from another, plant sap results from a third, plus whatever sensor data they’ve been trialling on top. Just the lab-based data alone is a nightmare: each report uses different units, different reference ranges, different ways of expressing the same nutrients. One lab reports phosphorus as P₂O₅ in mg/l. Another reports Olsen P in ppm. A third gives Mehlich-3 P in a completely different range.
Are you deficient or adequate? Impossible to say without manually cross-referencing every result.
Now multiply that across 15 fields, 4 test types and 5 years of history. Add the fertiliser applications you logged somewhere, the field observations your agronomist noted on a visit, the weather that might explain why nitrogen crashed in June; it’s all sitting in separate systems, email attachments, lab portals, spray records, desk drawers. Nobody has time to stitch it together into a picture where you can see the test result next to the application next to the weather event next to the outcome.
This is the gap that SoilBeat was built to close.
From scattered PDFs to one comparable dataset
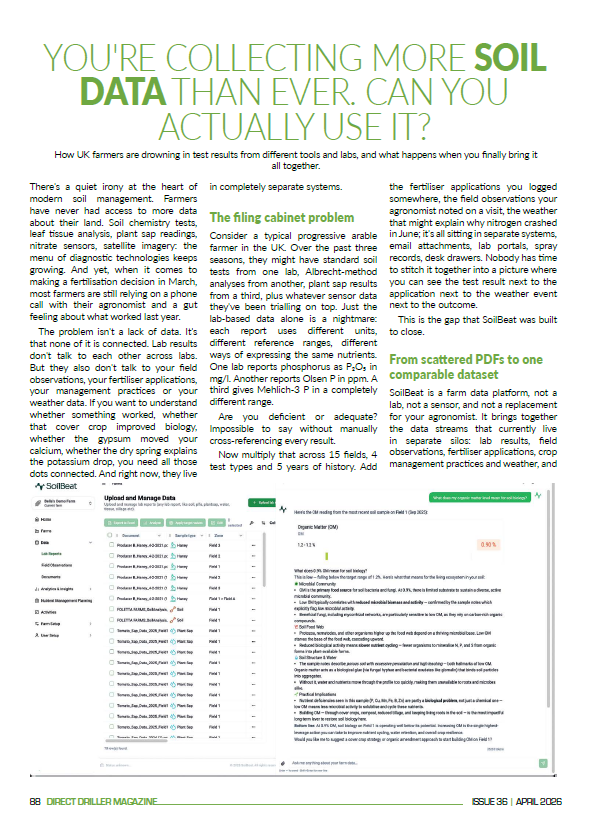
SoilBeat is a farm data platform, not a lab, not a sensor, and not a replacement for your agronomist. It brings together the data streams that currently live in separate silos: lab results, field observations, fertiliser applications, crop management practices and weather, and connects them per field and per season.
The platform’s AI parser handles reports from over 100 lab formats. Upload a PDF from any lab – Lancrop, NRM, Eurofins, a US lab, a Dutch lab – and SoilBeat structures the data into standardised nutrient readings, linked to specific fields and seasons. The system maintains 597 nutrient mappings across soil, plant sap, tissue, biology and water tests. It handles the unit conversions, the reference range differences and the formatting inconsistencies that make manual comparison so painful.
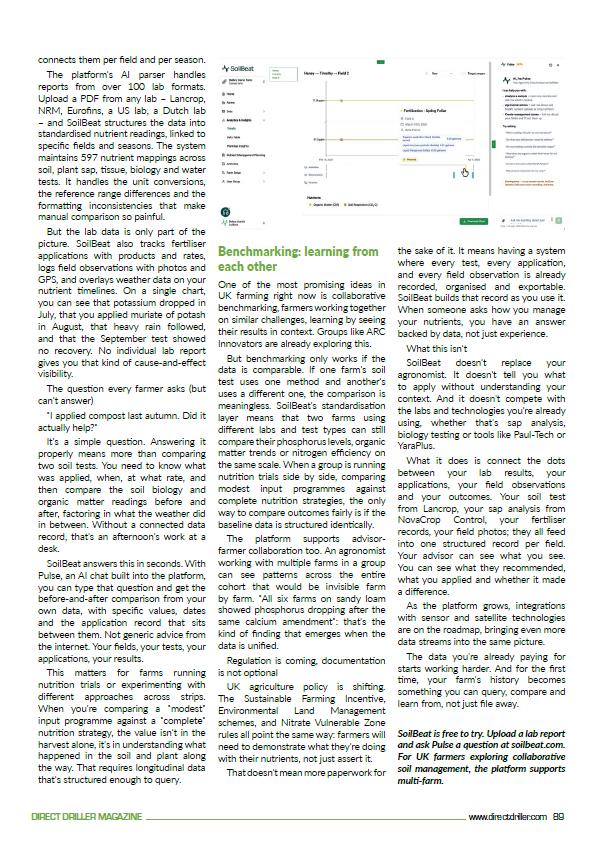
But the lab data is only part of the picture. SoilBeat also tracks fertiliser applications with products and rates, logs field observations with photos and GPS, and overlays weather data on your nutrient timelines. On a single chart, you can see that potassium dropped in July, that you applied muriate of potash in August, that heavy rain followed, and that the September test showed no recovery. No individual lab report gives you that kind of cause-and-effect visibility.
The question every farmer asks (but can’t answer)
“I applied compost last autumn. Did it actually help?”
It’s a simple question. Answering it properly means more than comparing two soil tests. You need to know what was applied, when, at what rate, and then compare the soil biology and organic matter readings before and after, factoring in what the weather did in between. Without a connected data record, that’s an afternoon’s work at a desk.
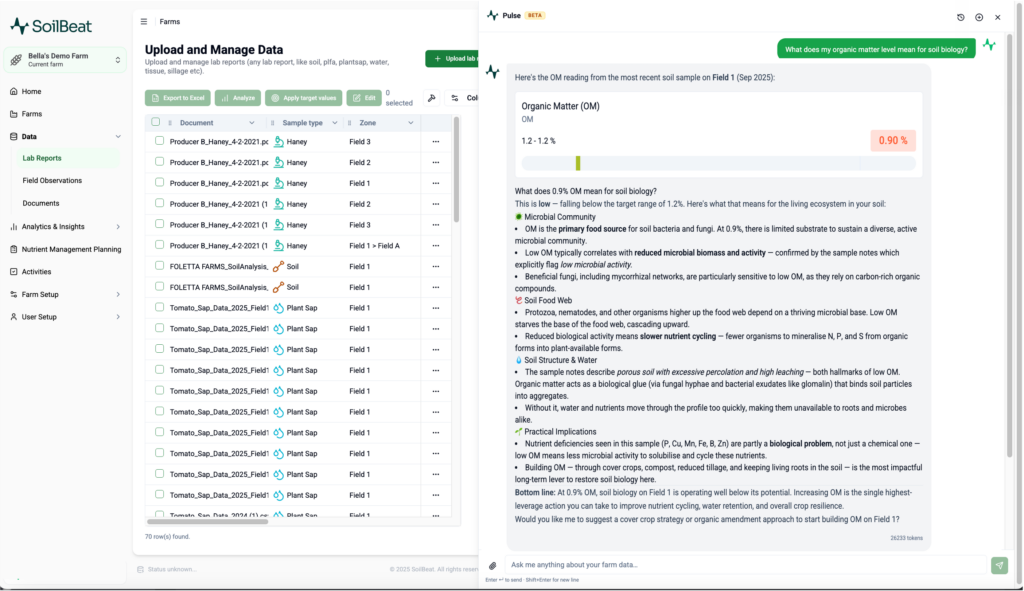
SoilBeat answers this in seconds. With Pulse, an AI chat built into the platform, you can type that question and get the before-and-after comparison from your own data, with specific values, dates and the application record that sits between them. Not generic advice from the internet. Your fields, your tests, your applications, your results.
This matters for farms running nutrition trials or experimenting with different approaches across strips. When you’re comparing a “modest” input programme against a “complete” nutrition strategy, the value isn’t in the harvest alone, it’s in understanding what happened in the soil and plant along the way. That requires longitudinal data that’s structured enough to query.
Benchmarking: learning from each other
One of the most promising ideas in UK farming right now is collaborative benchmarking, farmers working together on similar challenges, learning by seeing their results in context. Groups like ARC Innovators are already exploring this.
But benchmarking only works if the data is comparable. If one farm’s soil test uses one method and another’s uses a different one, the comparison is meaningless. SoilBeat’s standardisation layer means that two farms using different labs and test types can still compare their phosphorus levels, organic matter trends or nitrogen efficiency on the same scale. When a group is running nutrition trials side by side, comparing modest input programmes against complete nutrition strategies, the only way to compare outcomes fairly is if the baseline data is structured identically.
The platform supports advisor-farmer collaboration too. An agronomist working with multiple farms in a group can see patterns across the entire cohort that would be invisible farm by farm. “All six farms on sandy loam showed phosphorus dropping after the same calcium amendment”: that’s the kind of finding that emerges when the data is unified.
Regulation is coming, documentation is not optional
UK agriculture policy is shifting. The Sustainable Farming Incentive, Environmental Land Management schemes, and Nitrate Vulnerable Zone rules all point the same way: farmers will need to demonstrate what they’re doing with their nutrients, not just assert it.
That doesn’t mean more paperwork for the sake of it. It means having a system where every test, every application, and every field observation is already recorded, organised and exportable. SoilBeat builds that record as you use it. When someone asks how you manage your nutrients, you have an answer backed by data, not just experience.
What this isn’t
SoilBeat doesn’t replace your agronomist. It doesn’t tell you what to apply without understanding your context. And it doesn’t compete with the labs and technologies you’re already using, whether that’s sap analysis, biology testing or tools like Paul-Tech or YaraPlus.
What it does is connect the dots between your lab results, your applications, your field observations and your outcomes. Your soil test from Lancrop, your sap analysis from NovaCrop Control, your fertiliser records, your field photos; they all feed into one structured record per field. Your advisor can see what you see. You can see what they recommended, what you applied and whether it made a difference.
As the platform grows, integrations with sensor and satellite technologies are on the roadmap, bringing even more data streams into the same picture.
The data you’re already paying for starts working harder. And for the first time, your farm’s history becomes something you can query, compare and learn from, not just file away.
SoilBeat is free to try. Upload a lab report and ask Pulse a question at soilbeat.com. For UK farmers exploring collaborative soil management, the platform supports multi-farm.