GPS and other modern technologies, along with thorough trial protocols, can make farm trialling straightforward and routine. Decisions and innovations can then become thoroughly validated and tailored to real farming conditions.

This useful guide from ADAS outlines processes leading to successful farm-trialling and how to avoid the pitfalls. The guide covers trials conducted with ADAS Agronōmics support, trials using yield mapping technology without ADAS support, and trials where the yields are assessed by weighbridge.
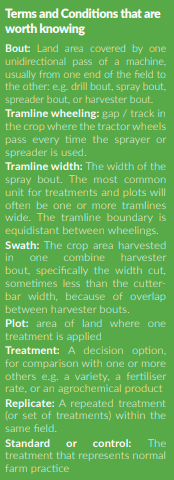
Firstly – What Question are you asking?
• What decision do you want to test? E.g. rotations, cultivations, varieties, fertiliser rates, new products, application timings? Does the importance of this decision merit the effort invested in a trial?
• Most questions have been asked and many answered already. Check with an expert (or search the internet) to see what research has already been done.
• Share your plans: several farms doing the same trial and getting the same results will make the conclusions much more trustworthy and valuable. • Define the control or ‘standard’ practice with which you want your new idea to be compared.
• For any question posed, you need an answer that you can use in future. So ensure that the results will be relevant to your farm and unaffected by expected future changes on farm.
• Average farm trials can ‘prove’ grain yield differences of 0.3-0.5 t/ha. Only the very best farm trials can ‘prove’ differences as small as 0.1 t/ha. Think about what difference you expect and what imprecision you can tolerate.
Secondly – Is your Farm set up for a Trial
Fields
• Do you have fields with the right crop which are big enough, square enough and even enough?
Equipment
• How easily can you apply the different treatments that you want to test?
• How will yields be measured: using yield mapping or a weighbridge? This will affect trial design and management.
• If using yield mapping, do you know how to retrieve and process the data?
• Can you geo-locate tramlines, treatments and yields accurately? Mobile phone precision is crude (>5m). RTK gives the best GPS accuracy (<1m).
• Can you acquire other useful measures? E.g. soil maps, crop sensing, satellite imagery, or drone photos.
Attitude
• Will you be willing to put up with extra hassle at harvest?!
• If using a contractor, are they fully on board?
Designing the Trial & Choosing the Field
Split fields versus Replicated Trials
• With split fields it is difficult to tell if any effect is real, or simply due to underlying variation. At the least, test any new treatment in a block with standard on either side, then gauge the variability between standard areas to judge your confidence in the treatment effect.
• Applying treatments in replicated plots takes more effort, but allows greater confidence in the results.
Designing your trial
• There is no single ‘best design’.
• First set the plot size according to the bout widths of treatment machinery, and your attitude to hassle at harvest.
• Plots should be two or more spreader bouts wide when testing fertiliser applications by spinning disc.
• Wider plots are necessary if you want to view treatments with satellite imagery.
• Rotational or cultivation comparisons (e.g. cover crops) normally need larger plot sizes than spray treatments, and are more hassle to replicate.
• Replicate your farm standard treatment at least twice, and ideally replicate all your treatments. The more replication, the more sure you will be of your result.
• Only test the number of treatments that allows sufficient replication within the uniform area available within the field. Avoid testing more than four treatments per trial.
Design of yield-mapping trials
• Plan your harvesting procedure before you finalise your plot size and layout. Aim for at least two full harvest swaths per plot. Wider plots are best if a precise harvesting plan cannot be guaranteed.
Choosing the right field and area
• Choose a field which is big enough, square enough, and even enough.
• Choose a field with suitable soil type, previous crop, variety, etc.
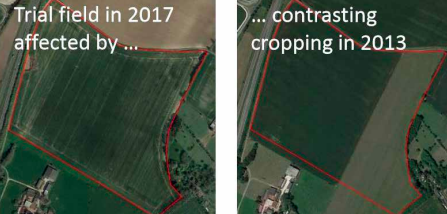
• Avoid fields and areas with recent differences in management e.g. fields previously split (see example below).
• Avoid areas with known problems of drainage or weeds (unless central to your question).
• Exclude headlands and areas which include trees, telegraph posts, etc.
• The trial area should be wide enough to accommodate the trial; using a thin field will limit the number of comparisons that can be made.
• The trial area should be long enough for sufficient yield measurements (ideally >200m) and to maximise the area over which the comparison(s) will be made.
Laying Out the Plots Fairly
Fit with prior patterns of field variation
• Note that ‘natural’ within-field variation in yield will almost always exceed the expected effects of your treatments, so you need to locate your plots very carefully to be as fair as possible.
• Inspect available satellite images (e.g. on Google Earth) and past maps of yield, soil conductivity, nutrients and NDVI, if available.
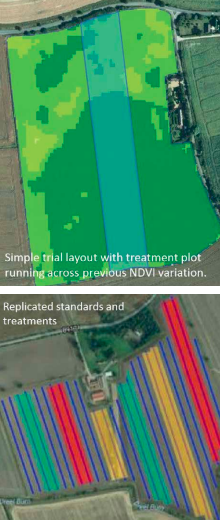
• If there is obvious variation, arrange the treatment areas so that comparisons will be fair. Ideally any patterns of variation should run across the tramlines, so that variation is not confounded with the treatments.
• Where the likely pattern of yield variability will run at rightangles to your treatments this can be an advantage, as you can see the effect of the treatment across different conditions e.g. soil zones.
Allocate treatments to plots
• Statisticians prefer treatments to be allocated to plots randomly, within blocks of replicates. This is especially important if there is a spatial trend across the treatment lengths.
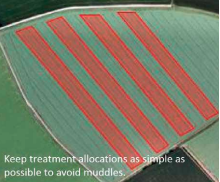
• There can however be advantages in systematic designs, not least simplicity. We prefer to alternate the standard treatment with the test treatments as above, so that a good estimate of spatial variation can be made, and good comparisons can be made with the standard.
Applying and Recording the Treatments
Mark and record trial and treatment locations unambiguously
• Make a proper record of which treatments were placed where, ideally using mapping software/ apps, or at least using a sketch on a field map.
• It is also worth marking the locations of the plots in the field using canes or flags.
• Tell all those that might be carrying out field operations about the trial and its requirements.
GPS for yield-mapping trials
• To accurately analyse yield mapping data, GPS positions of plots are essential for yield data to be correctly assigned to treatments.
• Your tramline and treatment locations may be recorded accurately on your tractor, but this is often difficult to extract and share.
• Record the GPS co-ordinates of the centre of the tramlines for all the treatment plots where they meet the headlands at both ends of the field.
• Ideally use a proper GPS device with a correction signal (e.g. RTK or EGNOS) as the accuracy of smart phones and sat navs is typically poor (>5m). GPS locations can be displayed in various websites and apps, including http:// gridreferencefinder.com/
Apply the treatments
• Equipment being used for applying treatments should be calibrated.
• When applying treatments, it is important that only the thing of interest is changed so that you can understand what is having an effect on yield. For example, if you are testing a spray, ensure that the different standard and test treatments are applied within a short time of each other and at the same water volume and pressure.
• Apply all other inputs uniformly over the whole field, so that the comparison of your chosen treatment with the standard is not confounded. It is usually best to avoid variable rate fertiliser applications over the trial area.
Crop Protection
Make explanatory measurements
• Depending on your question, it will usually be worth making some explanatory measures (e.g. of disease or by sampling for nutrient analysis).
• The more measurements you take, the more confidence you are likely to have in the outcome of the comparison you are making.
• Point measurements should be in adjacent positions along the length of each plot, georeferenced if possible.
• Effects ‘to a line’ coinciding with the boundary of a treatment can be particularly convincing. Take photos of any visual effects you can see.
• If you are able, it is often worth getting aerial imagery from a drone or plane.
• It is possible to acquire satellite imagery, though free imagery at 20m resolution is unlikely to show treatment differences unless plots are quite wide.
• Spatially referenced measurements (such as drone images) can be analysed statistically to gauge how much confidence you can place in any comparison.
• Keep a dated record of any visual effects of the treatment, or any spatial differences that could affect the results.
Plan for harvest
• Good harvesting is critical for trials whether you are comparing treatments using yield mapping, weighbridge or a yield monitor. Your optimal strategy will depend on the relative widths of plots and combine header, your willingness to harvest discard areas separately, and harvest logistics, e.g. the need to unload on the move.
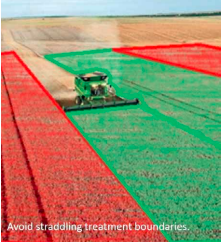
• Key factors for success are accurate harvester calibration, ensuring full header widths, not cutting across treatment boundaries, and maintaining consistency between plots. Harvest the whole field with the same combine on the same day.
• Yield mapping gives the best confidence that treatments differences are real rather than from spatial variation.
• Using a weighbridge gives accurate weights, but you need accurate measures of the area to get good yields
• Simply using the combine monitor for separate plots can give instant answers, but will be affected by measuring the area in non-full swaths, start and ends of combine runs and shortwork.
Harvesting – Harvesting your trial
• Harvest the headlands first
• Aim to be as consistent as possible between plots. Inclusion of wheelings in the combine swath can depress reported yield by around 0.5 t/ha.
• If not using yield mapping, you must avoid cutting across the treatment boundary in your yield area. If yield mapping, this data will need to be removed from treatment comparisons.
Harvest of yield-mapping trials
• Calibrate the yield monitor according to the manufacturer’s instructions. Ideally test the yield monitor against harvested grain weights over a weighbridge.
• Keep to a constant speed and try to harvest the whole trial under the same conditions and on the same day.
• Harvest in line with the tramlines.
• Keep the combine header full wherever possible, and aim to cut at least two full header widths per plot. A cut with standing crop on either side of the dividers will be fuller than cuts with an edge or wheeling to one side, even though the widths may be assumed to be the same. For example, a 30cm difference in actual swath width on a 10m header can give a 3% difference in calculated yield, around 0.3 t/ha.
• Combine direction can also affect measured yield, especially on slopes or in lodged crops. Extract yield data promptly
• Each combine system is different in the types of files used to store data and how these can be transferred and viewed.
• However, most yield data can readily be imported into farm management software such as Gatekeeper. The data are then relatively easy to export for comparison and analysis.
Keep good records
• Record how you harvested the trial, the time and date, and describe any problems.
• Take grain samples from each plot if appropriate, e.g. for grain protein analysis.
Harvest of weighbridge trials
• Accurate measurement of the harvested areas of each plot is essential for accurate calculation of yield. It is best to compare equal lengths of runs of a known harvested width (e.g. two combine runs per plot). Use good quality GPS tools or a measuring wheel to measure the length.
• If weighing grain from different areas of the field, remember that irregular areas are difficult to measure accurately and may compromise your results.
• If measuring harvested area with the combine yield monitor, avoid non-full headers and adjust width as necessary.
Analysing Yield Mapping Results
Sort out and clean the data
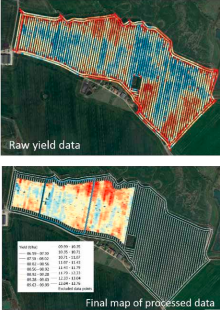
• Remove data from headlands and any values that are clearly aberrant. Various filters are available to remove data where the combine has stopped or changed direction. Also remove data from combine runs that straddled two treatments, or where the header was not full, even if the software has adjusted for width (sometimes an overcorrection is applied).
• Assign the yield data to treatment plots and calculate the mean of the cleaned data for each plot.
• Unfortunately, analysing yield map data from trials is not straightforward in many farm software packages. As an alternative, you can try QGIS mapping software, available free from www.QGIS.org.
Assess treatment effects
• Treatment differences will rarely be visually obvious from the yield maps
• Look at the spatial variation in the field and judge whether this was likely to have affected the comparisons.
• Variation in yields of standard plots can indicate whether treatment differences are real. Any treatment effect needs to be bigger than the difference between standard plots.
• If your treatments were associated with different input costs, you can calculate a gross margin for each plot.
• Remember that an absence of evidence of a treatment effect is not evidence of absence – it may be that your trial was not precise enough to detect the effect.
Drawing Conclusions – Check to avoid false conclusions
• Remember that inherent spatial variation in fields is normally larger than any treatment effect you may have imposed.
• Double-check that yields were assigned to their rightful treatments.
• Was the yield map similar to previous yield map(s) without treatments?
• Some spatial variation is inevitable, but this must be assessed and compared to gauge how sure you can be that a yield difference was really a treatment effect.
• How well did yields of replicates agree? • Consider the counterfactuals and any possible confounding factors.
• Spatial data from other sources, including in-season images and monitoring, should be used with the trial yield data to gauge how likely it is that treatment effects are real.
Share and discuss your conclusions
• If possible, compare your results with those of others. The same trial conducted on another farm or in the subsequent season can build further confidence in the results.
ADAS’ Agronōmics service
ADAS has d e v e l o p e d a process, software and new statistical p r o c e d u r e s so those c o n d u c t i n g farm trials can reach the right c o n c l u s i o n s quickly and easily. This includes;
Geoprocessing to define harvest d i r e c t i o n s , combine runs and distances.
Assignation of data to t r a m l i n e s , treatments and headland areas.
Data cleaning and processing to remove e x t r e m e outliers and anomalous runs, filter data anomalies, and correct for any offset between opposing harvest runs.
Spatial analysis to model spatial variation both related and unrelated to treatments, estimating the average treatment effect(s) and their uncertainties.
Reporting, displaying yields as maps with a standardised colour key and providing clear conclusions.
Meta-analysis of trial series.
For further information, and queries about analysing farm trial data using ADAS’s Agronōmics service, contact agronomics@adas.co.uk
This guide was been prepared by ADAS’s Agronōmics team including Daniel Kindred, Sarah Clarke, Susie Roques, Damian Hatley, Pete Berry and Roger Sylvester-Bradley and they can be contacted on +44 (0) 333 142950
