
Land Family Business were invited by Groundswell and Procam to benchmark a group of farmers who have been practicing no-till crop establishment for several years as part of conservation agriculture. Using our own client benchmarking process, it gives the opportunity to assess the financial performance of no-till conservation agriculture – against other no tillers and also against conventional crop establishment farming businesses. The results have large variations at every level – therefore, there is a great deal to discuss and analyse
Some Background
The 2017 Harvest Land Family Business Rural Business Client Survey shows some interesting results. The benchmarking was started in 1992 and until this year, all businesses had been ranked on the arable farming margin. This year we have included all other outside business income in the ranking, only excluding Rent and Finance – therefore the farms are ranked on Rural Business Profit.
Setting the Scene
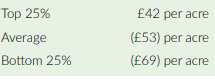
One of the most striking points is the margin from contract farming net of the power and machinery costs:
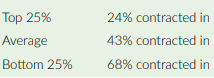
The relative contract area to the whole arable acreage is also significant:
Although the additional land generates a loss in margin, it does actually provide a contribution to overall costs because labour and machinery are fixed. If the additional land is given up the overall profitability will reduce
Therefore, many arable farming businesses are caught in a trap, or on a treadmill in having to expand acres to justify investment in machinery Adding acres in a competitive environment is not the answer The question is, are current contract farming arrangements really joint ventures or could machinery syndicates or share farming agreements be more effective in changing times?
It is particularly important to review current agreements for the potential change in the Basic Payment Scheme support. Profit before BPS, environmental payments and nonarable income is a loss of £10 per acre in the top 25% which indicates that farming businesses are increasingly reliant on other activities other than arable production. This may need a change in skillset for many farming families. What is also a little daunting is the increase in investment in machinery over the past year or so, with capital sometimes exceeding £300 per acre. The depreciation and contracting and hire costs from the Survey results added together:
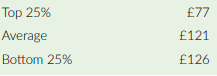
This is the annual cost of acquiring and having the use of machinery. This is not sustainable in an arable business. A management tool that many would benefit from is a machinery capital budget on a spreadsheet. This would show many key indicators such as capital employed in machinery per acre (including hired in), horse power per acre and an indication of future changeover costs per annum. Making business decisions based on correct financial information is vital however it is very difficult to obtain this information unless it is specifically produced and equally important – understood
As the industry faces one of the most radical changes in decades, many important business decisions will have to be made around farming kitchen tables over the next few months. Accurate management data is fundamental in making business decisions within farming families. These decisions could range from downsizing contract management agreements and selling land or property which could fund new enterprises to succession planning and retirement. It is quite common for example, for rental income to be subsidising arable losses. This is quite acceptable if it is a conscious business decision, however, all too often unless the accounts are prepared in management format these situations may continue undetected. Understanding the farm performance is crucial and we have a moral obligation to the next generation who are often asked to commit the rest of their lives to the business.
The fundamental problem with annual accounts on arable enterprises is that they will always cover an annual period which may not fit and conform to a production cycle. Typically, many farming businesses will have a 31 March year end which fits in with the annual tax period. But how does this relate to an arable farm with predominately autumn sown crops? In simple terms there are 3 types of accounts or budgets that can be prepared for an arable farming business:
• Financial statements following standard accounting practice, normally prepared by the farm accountant.
• Management accounts adjusted to financial statements often prepared by specialist farming accountants.
• Gross margins and associated fixed costs covering a production cycle, usually a budget prepared by farm consultants.
The profit shown in the first may bear no resemblance to the other two Once the homework has been carried out and a decision has been made to convert to a No Till Conservation Farming system – will it work on your farm?
Does No-Till Stack Up Financially?
The main points to be taken on board are:
• Yields of winter wheat average around 2.7 tonnes per acre – a reduction of around 20% from average conventional establishment yields
• Gross margin varies by around £100 per acre within the group – similar variation to conventional establishment. The average is lower than that from conventional establishment farms but the highest compares well with the Rural Business Survey average.
• Variable costs are £19 per acre lower in the no-till survey, this is significantly contributed to by a reduction in chemical costs.
• There is a substantial reduction in working capital requirement which will assist many businesses.
• Overall labour and machinery costs show a reduction of 43%
Drilling down further into the detail, the reduction in labour and machinery costs per acre from £213 in the average of the LFB Rural Business Survey to £120 in the no-till survey is significant. A major contribution to the reduction is the capital tied up per acre in machinery, resulting in a reduction in depreciation. Most arable businesses have been breaking even over the last 2 or 3 years because of high inflation in machinery costs, equating to £300 capital per acre in many arable businesses.
No-till provides a solution to this. In summary, there are lower yields and lower costs, therefore one of the key indicators is the cost of production per tonne. The cost of production per tonne for winter wheat in no-till is £101 and in conventional establishment businesses is £111. Inputs and paid labour costs in the no-till group are higher per tonne at £70 compared to £57 in the LFB Rural Business Survey. The big savings are because of machinery costs per tonne at £31 compared to £54.
Soil type and weather have a larger impact on no-till systems than conventional establishment. Therefore, they must be flexible to react to local conditions during a season. In conclusion, no-till establishment needs a completely different approach and way of thinking to the historic ‘Yield is King’ approach. This needs individuals who are prepared to question convention, take risks and be innovative. It must be remembered that no financial account has been taken for the increase in soil health and other environmental benefits. The rewards are achievable, but we need to be sharing knowledge to get there. To discuss further and get involved in benchmarking, please contact Gary Markham on 07970 794495 or email gary.markham@ landfamilybusiness.co.uk.
