Written by Becky Willson from the Farm Carbon Cutting Toolkit
The old adage of you can’t manage what you can’t measure is certainly true of carbon accounting.
But when it comes to agriculture, measuring carbon isn’t as simple as it may first seem. The variation of emissions and carbon stocks are due to the fact that we are trying to measure biological systems, which are impacted by climate, soil type, topography and vegetation, as well as what we as farmers are doing in terms of our management. Which makes the whole thing a little tricky. However undaunted by this complexity, carbon metrics are an essential tool that farmers can use to not just identify climate solutions, but also to baseline the farm’s emissions and drive technological change. Identifying the carbon footprint of a farm business is the first vital step in being able to quantify the contribution that the farm is making to climate change. A carbon footprint calculation identifies the quantity and source of carbon dioxide, methane and nitrous oxide emitted from the farm (as well as carbon sequestered in soils and woodland) highlighting areas where improvements or changes can be made to reduce greenhouse gas emissions.
Unless you have been hiding under a rock recently, you can’t have failed to notice the increased attention that the carbon credentials of farms has been receiving. Whether it is a way to assess the sustainability of one diet choice over another, or a report on the often outlandish claims of livestock production systems, carbon is everywhere. But what does it really mean for the farmer, and is there truth behind the rhetoric? Greenhouse gases are much talked about but they are inherently intangible. You can’t see, taste, hear or touch them; and they are all gases that are released in relatively small quantities on a continuous basis. So how do we understand what is going on with them and how do we talk a common language?
Outside of agriculture and when looking at reports, emissions are commonly communicated about as carbon emissions.
However on the farm, carbon dioxide isn’t the main issue, it is mainly the emissions occurring as nitrous oxide and methane which are not just a larger part of the emissions attributed to farms, but are also more potent in terms of their effect on the warming climate. In order to make sure that we are all talking the same language, all emissions are converted into a carbon dioxide equivalent (with methane being 30 times more potent and nitrous oxide 298 times more potent than carbon dioxide). By converting them all to carbon dioxide equivalents (CO2e) we can talk in a common language about kilos or tonnes of CO2e.
Reducing carbon emissions in a farming business makes sense on many levels. High carbon emissions tend to be linked to high use of resources, and / or wastage, so reducing emissions also tends to reduce costs. This makes the farm more efficient and should improve profitability. As well as the business opportunities that come from reducing emissions, farmers and land owners are in the unique position to be able to sequester carbon both in trees, hedgerows and margins and within the soil. Before being able to reduce emissions, you need to know where the emissions are coming from. Are the largest emissions coming from livestock, soils, fuels, or fertilisers? It is vital to get a picture of your business which is made possible by carbon footprinting.
Choosing a tool to use
There are various carbon footprinting tools that have been designed for use by individual farmers (or groups of farmers) who are interested in understanding what is happening on-farm. Although the simple principle of completing a carbon footprint assessment is the same (emissions minus sequestration equals footprint), within that there remains variation between what scope and boundaries the tools use to calculate the results. Boundaries of a calculation determine what aspect of production is being assessed; for example whether you are calculating the emissions associated with one farm enterprise or the whole farm, or whether it is assessing operations within the farm gate or taking account of what happens off farm. A key part of deciding what tool to use centres around what you want to use the footprint for.
Marketing – if you are wanting to use the results for marketing purposes, it is a good idea to choose one that has a clear method attached to it, which sets out what is included and excluded from the calculations, that way you can be completely transparent about your carbon credentials. A management tool – if you are planning on using the results and the data as a management tool, perhaps to highlight areas to improve in the future, then you will want to use a tool which allows you to evaluate the impact of changing your management. These tools tend to need more data added in at the start so that the impact can truly be seen. An interest – if you are just interested in what might be happening in carbon terms on your farm, then again choosing one that explains clearly what is included and omitted, and shows the footprint broken down into key areas is a good starting place.
Sequestration – in or out?
A key question to look at when footprinting is whether carbon sequestration is included in the calculation. Carbon captured within trees, hedgerows and field margins as well as the carbon held in soil is an important part of the footprint and shouldn’t be overlooked. If the tool doesn’t include sequestration then the footprint will be looking at the negative without the positive! There are a range of options that start from free tools that can be used in the farm office to paid for services that come with an advice service attached to them with recommendations for the future.
There are some supply chains within agriculture where carbon footprinting is already taking place. Most dairy farms are already being foot printed as part of their milk contract, however in other farming sectors the take up has been slower. Tools include the Cool Farm Tool, AgreCalc (which is used in Scotland) and the Farm Carbon Calculator. The golden rule is, once you have decided what tool to use, stick with it, as there are differences within the methods used in each calculator, so comparing results between calculators is meaningless.
Getting started
Once you have decided which tool you are going to use, the first step is to gather all of the input data. This includes information on fuel use, livestock numbers, fertiliser inputs, use of materials, waste produced etc. In order to be accurate you need to be comprehensive in your assessment. The list can look daunting at first, but if your record keeping is reasonable then this process should be achievable in a couple of hours. One you’ve done it, the next time will be quicker! Once you have the data, it’s just a case of entering it into the calculator, which shouldn’t take more than an hour, after which you should have a breakdown of carbon emissions by sector, both in amounts (kg or tonnes of CO2) and percentages of the total footprint by category. Armed with this data you are then ready to think about how to reduce emissions and increase sequestration.
When completing a carbon footprinting although value can be seen from completing it as a one off exercise, the really interesting part comes when the process is repeated at regular intervals, usually annually. When you do this you can start to see what direction the farm is moving in and whether the actions you’re taking are working.
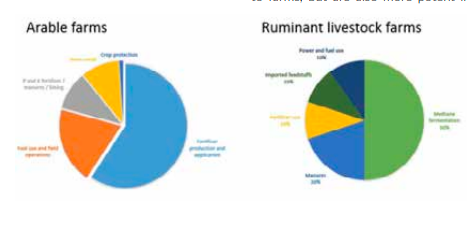
Emissions sources
Although each farm will vary in its carbon footprint, the charts below show the average breakdown of emissions across a typical livestock and arable farm.
Next steps
So once you have the footprint of the farm, deciding what to do is the next key step. The footprint result will be reflected as a carbon dioxide equivalent, but should also show you where the emissions of nitrous oxide and methane are produced. Key areas to focus on are the management of soils, fertilisers, manures, livestock, cropping, energy and fuel. There are numerous opportunities to reduce emissions and costs as well, leading to improved resilience and profitability, as well as opportunities to improve carbon sequestration and soil health, the ultimate resilient business model! Absorbing more carbon than the farm emits is a goal that all farmers could work towards and understanding the farm’s current carbon position by footprinting is the first key step.
Currently agriculture is one of the only industries within the UK which is under voluntary greenhouse gas emissions reductions, however we are not going to be in this position for long. The spotlight is being well and truly shone at agriculture’s carbon credentials at the moment, and this offers an opportunity for us to take the first step and understand what is happening on our individual farm, and what we can do to improve profits, reduce emissions and build soil health and sequestration. Carbon offers a fresh lens through which to evaluate our business and build resilience for the future.
Footnote – Farm Carbon Cutting Toolkit – which provides practical help and advice to farmers on reducing greenhouse gas emissions, improving energy resilience and building soil health. FCCT’s carbon calculator has been designed by farmers, is free to use and the new version will be launched at the Oxford Real Farming Conference in January 2020.