It is more accessible and affordable than ever before, but do you know your RGB from your NDVI? Jonathan Trotter from Agrii delves into the details of satellite crop scanning
Unprecedented access to satellite imagery is giving growers a clearer and timelier picture of what is happening in crops throughout the season. Different types of imagery each bring their own strengths – from high-resolution optical data that highlights changes in crop colour and canopy development, to radar systems that can see through cloud cover and operate reliably in all weather conditions. The challenge is understanding where each approach delivers the most value, and whether there is a single option that allows farmers to confidently hedge their bets.
The most common form of satellite imagery is Normalised Difference Vegetation Index (NDVI). The science around NDVI is based on the principle of healthy vegetation absorbing red light (used for photosynthesis) and reflecting near infrared (NIR) light. Based on this understanding, NDVI uses the contrast between these two wavelengths to indicate crop health and (to a degree) biomass, explains Jonathan Trotter, Technology Trials Manager at Agrii.
“NDVI is a relative greenness index rather than a direct plant health index. It is useful for monitoring changes in relative greenness over time, which can then be related to plant health,” he adds.
The reason NDVI is best at examining crop performance across a field over time is that it is on a fixed scale from -1 to 1, says Ben Foster, RHIZA Product Manager. The colour range on an NDVI image taken in one year is directly comparable to that from the same field taken at any point in the past.
“It is really useful for looking at establishment and crop growth early to mid-season. Because of this, NDVI tends to be the go-to for developing variable rate nitrogen plans for early spring,” adds Ben.
“Although NDVI provides a qualitative measure of early-season growth and can be used for year-to-year comparisons, it should be used alongside ground truthing,” says Jonathan.
“Farmers need to know if an NDVI score of 0.58 in a wheat crop is good or bad,” he adds. “Is it showing stress from inadequate nutrition? Is it actually showing signs of drought? Or is it doing well for that soil type with the recent weather? It needs context and ground truthing.”
Another reason to ground truth the data is to determine whether the imagery is providing data on your crop or a combination of your crop and any weeds, advises Jonathan. He cites an example of this that came from Agrii’s Scottish Digital Technology Farm last year.
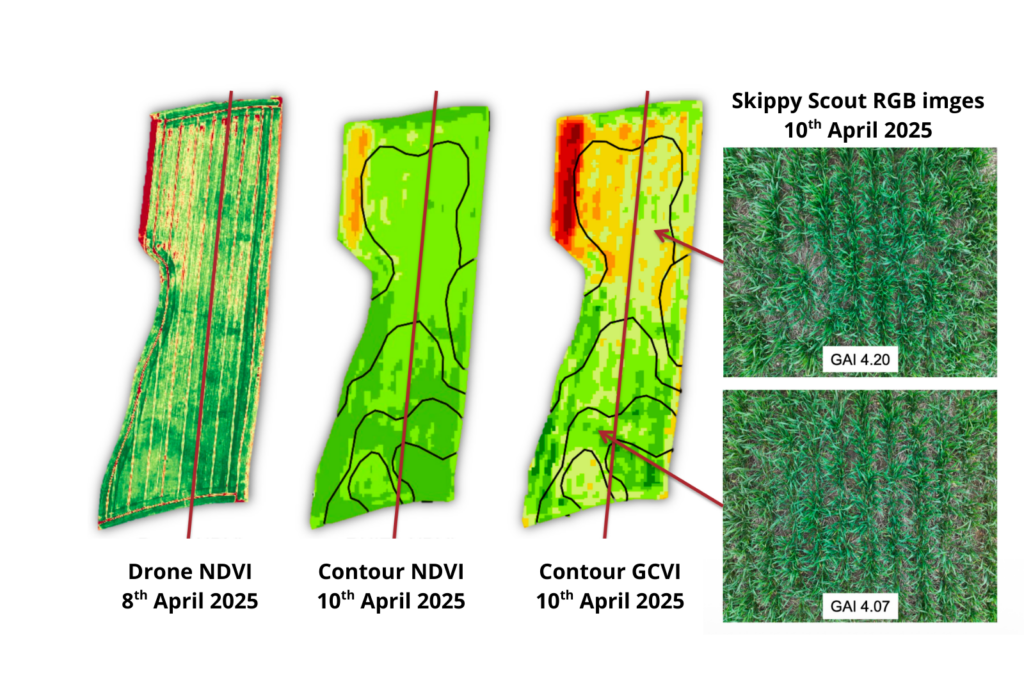
“From the NDVI imagery we captured, you’d potentially treat the field differently based on the darker green areas looking more advanced because of the higher biomass.
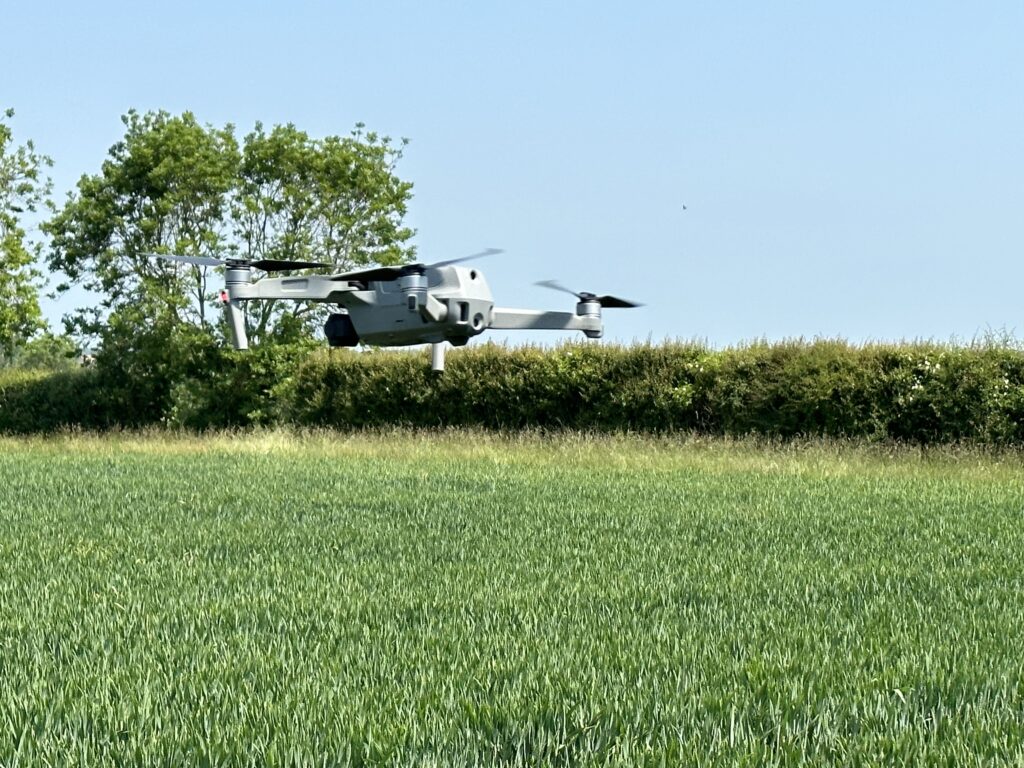
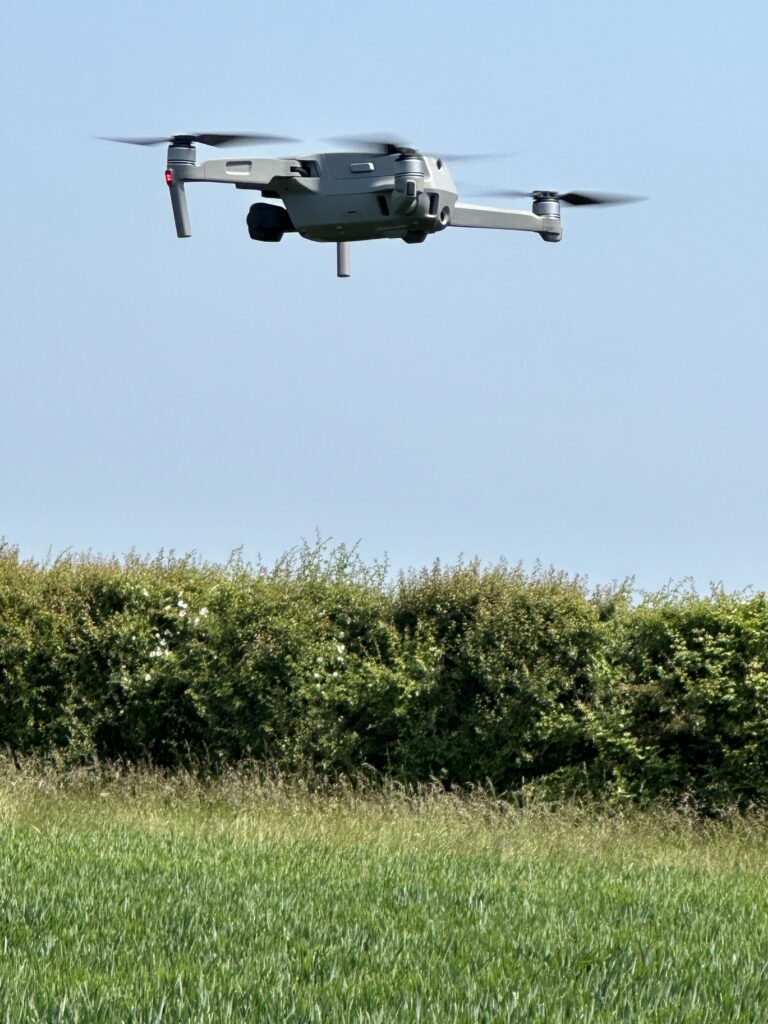
“We then used our drone crop surveying tool, Skippy Scout, to ground truth this. Skippy Scout can determine the Green Area Index (GAI) of the crop and uses AI to identify weed species, which it then removes from the calculation. This means we are able to accurately determine crop biomass and treat it accordingly.
“In this example, we discovered that a percentage of this relative greenness was actually due to the annual meadow grass in the crop and were able to adjust our variable rate strategy to account for this.
“By ground truthing NDVI with drone imagery, we effectively tune up the resolution of remote sensing from 5-20 m2 down to cm2 level data.”
Once a crop reaches a full canopy, then NDVI becomes a much less reliable means of measuring a crop’s performance, says Ben. This is where a switch to normalised difference red edge (NDRE) is usually necessary. NDRE measures light in the near infrared red-edge spectrum. The NDRE index saturates less easily as the canopy fills out, allowing it to penetrate the crop at this stage and measure nitrogen stress and chlorophyll concentration.
An alternative to NDRE is the green chlorophyll vegetation index (GCVI), which is one of the two free satellite imagery options on Agrii’s Contour digital farming platform, says Ben.
“GCVI looks at green reflectance rather than red, which is more responsive to variations in leaf chlorophyll. A key difference is that the scale is relative rather than fixed, meaning it moves as the image changes throughout the season.
“You could look at a GCVI image and see what appears to be a poor part of the field, but it is relative to the rest of the field. Again, this makes a farmer’s understanding of their fields and ground-truthing satellite imagery crucial,” he explains.
Regardless of the type of satellite image, they all require an unobstructed view of the field to provide valuable data. The UK’s cloudy weather offers a significant challenge to this. If there is a sustained period of unsettled weather, it is not unknown to wait three months for a usable satellite image, says Ben. Most digital framing platforms use the last best image they have to model how the image has moved forward over time.
“The problem is that there’s no fresh imagery being fed into the system over time. The Contour platform is unique in this regard because it has access to ClearSky, which can penetrate cloud cover.
“Satellites fire radar waves at the crop, which bounce around in the canopy before being detected by the satellite in space. This is an excellent alternative for effectively determining biomass. We model it in Contour to look like an NDVI image by comparing it against our NDVI data at a large scale,” says Ben.
Another technology we are starting to see being used is hyperspectral imagery via satellite, says Jonathan. This effectively uses more wavelengths than a traditional satellite to achieve similar crop health interpretations. The concept being that the more data you have, the better the interpretation will be.
However, he provides a note of caution about the capabilities of hyperspectral imagery. “Although hyperspectral imagery has advantages in being able to monitor plant health in greater spectrums, without ground truthing the data or interpreting the context with a detailed understanding of what is going on within the soil, it presently offers little over and above current capabilities, which are free and accessible via Contour.
“Unfortunately, hyperspectral imagery is also very sensitive to cloud cover and haze, which is an issue as there are very few hyperspectral satellites at present, meaning data for decision management can be infrequent.”
The different types of satellite imagery at a glance:
| Index | Data type | Best for | Why? |
| NDVI (Normalised Difference Vegetation Index) | Red (620–670 nm) + NIR (841–876 nm) | Early to mid-season crop vigour | Shows overall biomass and canopy greenness; can saturate in dense canopies. |
| NDRE (Normalised Difference Red Edge Index) | Red-edge (705–750 nm) + NIR (780–850+ nm) | Mid to late-season, nitrogen status | Red edge penetrates dense canopies, highlighting chlorophyll and nutrient levels. |
| GCVI (Green Chlorophyll Vegetation Index) | Green (540–570 nm) + NIR (780–900 nm) | Biomass & canopy growth, nitrogen status | Tracks greenness and chlorophyll concentration throughout the season; less prone to early saturation. |
| SAR (Synthetic Aperture Radar), eg ClearSky | Microwave radar (varies by sensor, eg 5–10 cm wavelength for C-band) | All-weather monitoring | Penetrates clouds and works day/night; detects soil moisture, structure and crop biomass. |
| RGB (Red, Green, Blue) | Visible spectrum (Red, Green, Blue: 400–700 nm) | Visual inspection, scouting | High-resolution photos; easy to interpret but limited for detailed physiological metrics. Best used in combination with tools like Skippy Scout. |