Over the past thirty-five years, the Allerton Project has been at the forefront of many developments in how we now manage the farmed landscape. In that time, we’ve collected a huge volume of often quixotic data on everything from farmland bird and insect numbers to the rooting depths of plants under different biostimulant treatments. However, until the 2024-5 growing season, we hadn’t undertaken a comprehensive farm carbon audit; having done so, the results were illuminating.
Carbon (its storage on-farm and movement through the system) is one of the key focuses of the industry today (or so it seems). Yet according to the latest Farm Business Survey data from Defra (2023-4), only 20% of English farms had undertaken one (so at least the Allerton Project was still technically in the vanguard!) Unsurprisingly, dairy farms were the most likely to have undertaken a full carbon audit (57%), while (surprisingly to me) less than 10% of specialist pig/ poultry and horticulture units had completed one. For most other sectors, the figure was between 15-20% (figure 1).
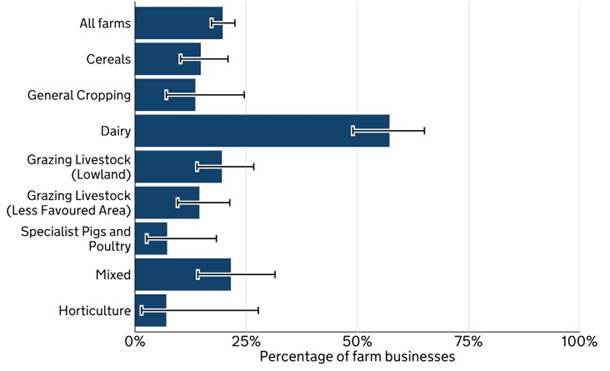
Figure 1: Percentage of farm businesses that have completed a carbon audit by farm type, England 2023/4 (Defra)
Large farms were more likely to have completed a carbon audit than smaller units, while the top two reasons for doing so (by a considerable margin) were cited as “contractual obligation” and “general interest”. The main reasons cited as to why farms hadn’t opted to undertake an audit were “unsure of benefits”, followed by the delightfully straightforward “not interested” and “time”.
As a research and demonstration farm, I considered it important that the Allerton Project had been through the carbon auditing process so that we could have more informed discussions on the topic. As a commercial arable unit, there is currently limited pressure on us to undertake one from the supply chain, while English post-Brexit agricultural support policy has no data collection requirements whatsoever (unlike the devolved nations, where the value of data collection and baselining is clearly considered to be much greater).
However, as with completing your own soil, nutrient or IPM plan, regardless of the current regulatory or commercial requirements to undertake such an exacting process, I do think there’s value to be gained in understanding better the flow of carbon through your own farm business and how that baseline knowledge of the “big ticket items” might help shape future decision-making. Certainly, given the direction of travel of the farming sector in terms of sustainability, having a baseline of any number of natural capital inventories can be no bad thing; who knows when it will come in handy and generate a cash value?
So, what did our own audit, conducted with the Farm Carbon Calculator, reveal? The headline is that the Allerton Project is, to the best of our ability to demonstrate, “carbon negative”. Excluding our visitor centre and research labs and including only the farming operations (including contract grazed sheep), we are emitting 318t of CO₂e, yet removing 436t via sequestration, for a net balance of -117t CO₂e and an average of 370kg of sequestration per hectare.
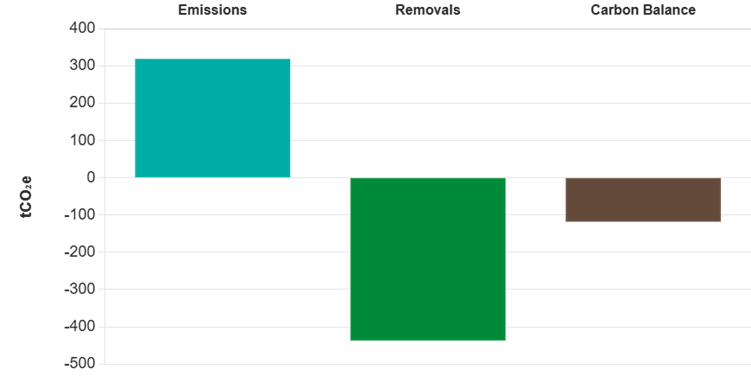
Figure 2: The Allerton Project farm’s carbon balance (2024-5 season)
Emissions come from the expected sources, primarily “inputs” (of which some 91% was nitrogen fertiliser) and diesel fuel, together accounting for some 75% of total farm emissions. However, the removals were more interesting, with 19ha of established woodland accounting for less than 20% and our agri-environmental options accounting for the rest. Within that basket, the biggest carbon sponges were 29ha of herbal leys (28% of removals), 16ha of harvested low-input cereal (9%) and 11ha of grass buffers and winter bird seed areas (jointly contributing another 14%).
Given the uncertainty surrounding ELM/SFI in England since March 2025, combined with the second looming cliff edge for existing CS Mid-Tier agreements this coming December, not only does the chaotic implementation and lack of budget for post-Brexit policy continue to place our biodiversity and water quality targets at risk, but questions must also be asked about the impact of losing agri-environmental areas for our climate goals, too. The Allerton Project was among those farms last autumn planning to put much of our environmental area back into cropping rather than self-fund such areas in the absence of SFI; happily, a 12-month extension was offered to Mid-Tier schemes at the eleventh hour. Frustratingly, it was too late to avoid the cropping of our herbal leys and legume fallows – potentially to the detriment of our (and the nation’s) carbon balance.
Yet, a huge amount of goodwill and confidence has been lost in the government’s ability to deliver a functioning farm support/environmental scheme; expectations are generally low for SFI’s return in the autumn, and we all know the budget isn’t there to support every farm to deliver on its potential. What a tragedy if decades-old environmental areas, many originally taken out of production because of their low yield potential, were put back to cultivation to the detriment of the carbon built up there over the years. But needs must.
It was also, more generally, of great surprise to me that the Allerton Project was so solidly carbon negative. We are, at heart, a largely conventional operation still using significant amounts of nitrogen and tillage where needed. I can’t help but wonder what the true picture would be across the country if we could generate more of this Tier 3 (farm level) data and rely less on Tier 1 & 2 (international and national averages) to estimate the climate impact of UK agriculture, currently thought to be 12% of national emissions – and rising. Much of what the Allerton Project practises is now commonplace, and only some 15% of our arable area is permanently taken out of production into conservation margins and the like. The ongoing AHDB Environmental Baselining Pilot of some 180 farms will perhaps shed some light on this when its results are published.
Indeed, the Farm Carbon Calculator even allows you to estimate the difference between using the standard metric for livestock methane emissions (GWP100) and the GWP* metric being championed by organisations such as AHDB. Under this scenario, our sheep emissions were reduced by 75%. Research at Allerton also shows that feeding small amounts of tannin-rich feeds, such as (in our case) willow, can help reduce emissions by around 50%. Thus, there is perhaps massive scope for a fundamental reassessment of the carbon impact of grazing livestock in a Tier-1 scenario.
There are, however, certain perversities in focusing too closely on carbon. For example, in separate modelling we conducted on our cropping a few seasons ago using the Cool Farm Tool, we saw a 28% decrease in carbon intensity per tonne of wheat produced if we baled and removed our straw vs the farm practice of returning to the soil. A supply chain focused too closely on carbon reduction might therefore advocate for the removal of valuable organic matter as a matter of course, in isolation from its longer-term benefit for soil health and nutrient cycling.
It was also clear from our report that although we were in the lowest 40% of all FCT users for emissions per tonne of output and the lowest 20% for emissions per hectare, we were also in the lowest 40% for crop yield; the “yield dilution” effect needs to be taken into account when considering the true carbon impact of, for example, very high-input-high-output systems, which aren’t necessarily “worse” for carbon emissions.
There’s also significant danger of the “crap in, crap out” scenario when it comes to using any calculator, and certainly when it comes to the arable and red meat sector, there are still very many farms who don’t record much of the data needed for accurate calculations, leaving them reliant on Tier 1 and 2 average data, which will significantly reduce the value of the finished report. This is something we do need to address going forward, as it’s inevitable that such data will become a necessary part of doing business. But farmers need to see the benefit of time-consuming data collection.
Many farmers clearly also feel that – given the massive differences reported between the different calculators – there is a credibility gap between the reality on-farm and what a carbon report might tell you. Certainly, this is increasingly recognised, hence the recent Defra-sponsored research into the issue by ADAS and subsequent agreement between three of the biggest players (Cool Farm Alliance, Farm Carbon Toolkit and Agrecalc) to attempt to harmonise their outputs. Some of our research at Allerton – for example, concerning nitrous oxide emissions from soils in varying states of compaction and waterlogging – would also raise a big flag over exactly how we can accurately account for all emissions in complex and dynamic real-world scenarios.
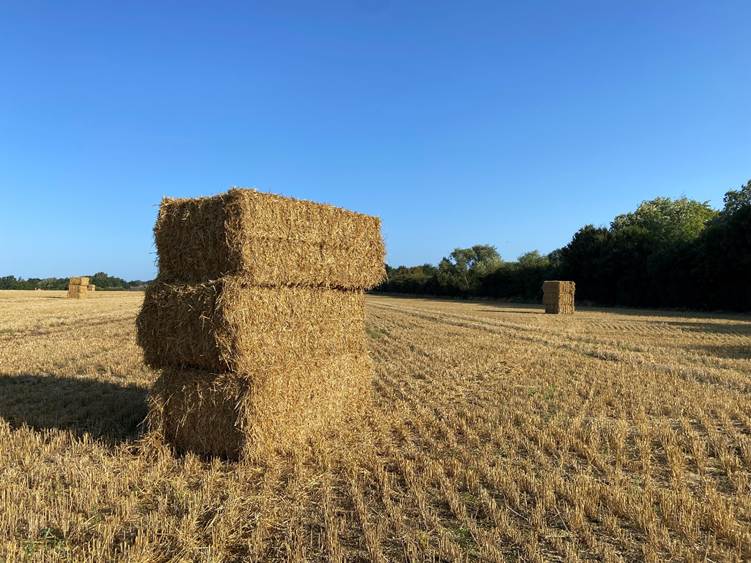
Better for farm carbon balance – but at what cost?
However, the experience of having conducted a farm carbon audit was highly instructive and certainly puts us in a better position going forward to consider where and how we can make easy wins to reduce our farm’s carbon intensity and, hopefully, increase profitability. As more such data is collected in the coming years (sadly, in a non-organised way due to lack of coordination from government) we will hopefully see a more accurate picture of the climate impact of farming in the UK, which I can’t help but think might be more positive (well, carbon negative, but you know what I mean) than we realise.