AHDB will launch a powerful new BYDV tool in August. Jason Pole explains how it will give farmers greater control over aphids in winter cereals.
The challenge
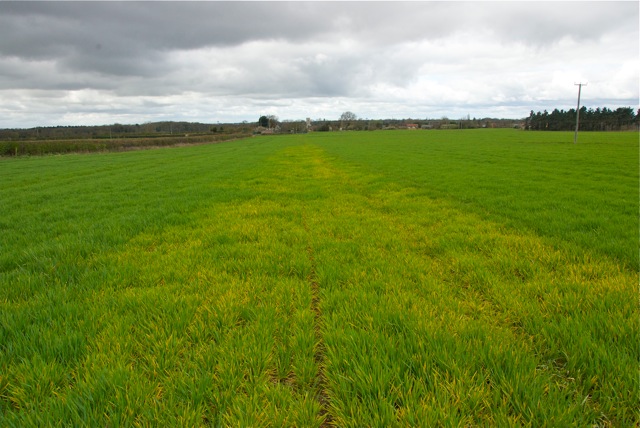
Barley yellow dwarf virus (BYDV) can cause major yield losses in winter wheat and winter barley, so virus-spreading aphid vectors need careful management, especially in higher-risk situations. When neonicotinoid seed treatments were withdrawn in 2018, it set back aphid management by decades and saw a return to the routine use of foliar pyrethroid sprays in the autumn. Although pyrethroids are relatively cheap, every spray puts pressure on non-target organisms and increases insecticide-resistance risks (some UK grain aphids already have moderate levels of resistance).
With no other mode of action groups authorised for BYDV management, minimising pyrethroid sprays is a critical resistance-management tactic.
Additionally, as the UK climate warms, aphids are flying for extended periods and staying active in the crop for longer. Certainly, the relatively warm conditions in winter and spring have contributed to a relatively high number of reports of BYDV symptoms in UK crops this year.
The new BYDV tool will underpin better management decisions to keep disease at acceptable levels.
In this article, I discuss what sets the new BYDV tool apart from its predecessor, how farmers shaped its development and where you will find the tool.
Current tool
The current BYDV T-sum tool has been around for several years. It predicts the presence of the second aphid generation (which is most associated with BYDV spread) in crops with just two inputs:
- A start date (crop emergence or spray date)
- Accumulated daily air temperatures (from the start date)
It is a simple and effective approach but overlooks many nuances that influence virus-transmission risks. To compensate, it is conservative and tends to suggest more sprays than may be required to prevent unacceptable yield losses.
Aphid advances
Following decades of advances in aphid biology science, virus epidemiology and computer modelling, we knew there was scope to develop a much better tool. In fact, this was a key conclusion of a 12-month review of BYDV risk (2018–19) by the Game and Wildlife Conservation Trust (GWCT).
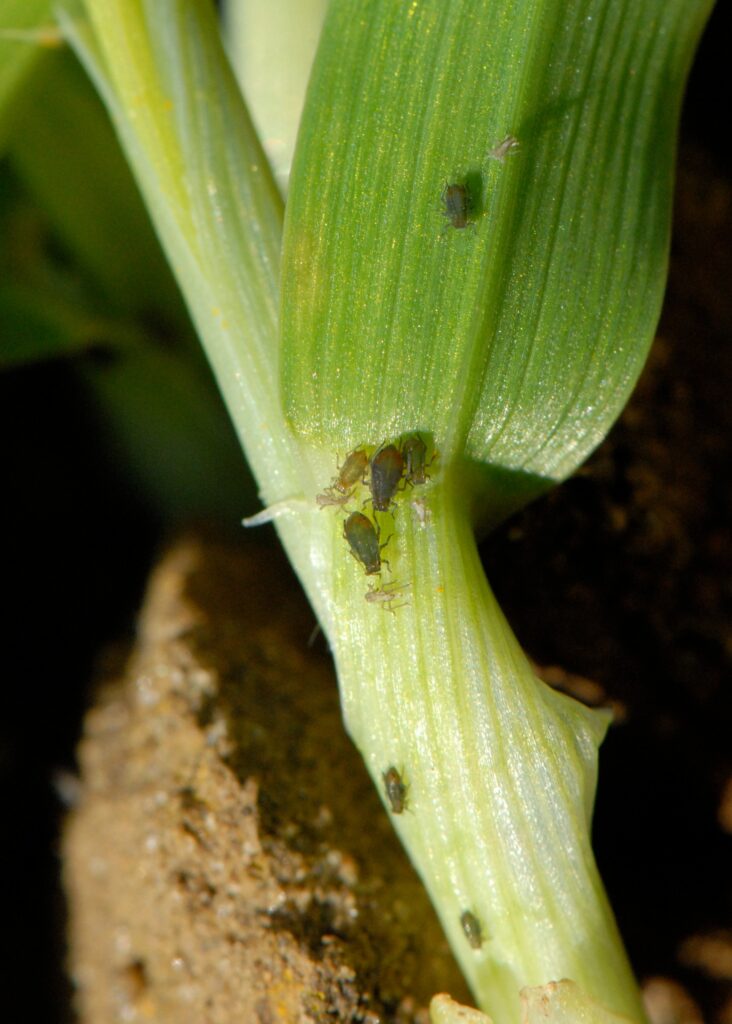
Based on the review’s recommendations, we funded ADAS in 2019 to develop a model to account for additional measures of risk and provide comprehensive information on BYDV. Although bird cherry-oat aphid, rose-grain aphid and grain aphid all transmit BYDV to cereals, the ADAS work confirmed that the former aphid is by far the most significant virus vector across the UK, so we trained the model on this species.
Rose-grain aphid is rarely seen in winter crops (it overwinters on roses) and grain aphid flies in relatively low numbers in the autumn, which was confirmed by recent in-field monitoring work and results from the Rothamsted Insect Survey (RIS) suction-trap network (across England and Wales).
Although grain aphid can spread BYDV, this only happens in limited situations, such as when relatively high summer infestations use green bridges (e.g. grass weeds or cereal volunteers) to move to following cash crops, with early emerging cereals (before mid-September) mostly affected.
Tool data
The current BYDV T-sum tool assumes aphids are present and all carry the virus at the start date, whereas the new BYDV tool makes use of aphid data from suction traps.
According to RIS, suction trap data is representative of aphids flying over a radius of about 80 km. The ADAS project found that suction traps provide a good indication of aphid migration trends, crop infestations near traps (especially up to 10 km away) and the proportion of aphids carrying virus up to 40 km away.
Based on our virus screens of aphids caught in suction traps over several autumns, the model assumes about 20% of aphids carry BYDV, but this figure is replaced with in-season data (when available) to provide the best indication of risk. Although the 20% value may appear low, it is because the virus is not passed from parent to nymph, so new aphids need to feed on infected plants to take it up.
The investment (skill, time and money) needed to locate and identify aphids (and determine if they carry BYDV) means that suction-trap results provide a very useful proxy for in-field pressures.
In addition to aphid pressures, the new tool considers many other data sources automatically. For example, it imports local temperature (minimum, maximum and mean) data. For forecasting, it uses five-year historic data for full growing seasons (1 September to 31 August), as well as in-season forecast temperature data (typically, up to the next ten days), which is continually replaced with actual local data.
The tool also considers pyrethroid insecticide persistence (which can still deliver high levels of control several days after application) and accounts for the diminishing returns associated with follow-up sprays.
The tool only requires a few farm-specific inputs to run initial risk reports:
- Field location (to tell the tool where nearest suction trap is and the best weather data to use)
- Field surroundings (arable or other)
- Drill date
- Crop type (winter wheat or winter barley)
To fine-tune the results for your field, we recommend you override the default economic and agronomic values:
- Established plant population density
- Predicted yield
- Grain price (current or expected)
- Sustainable Farming Incentive (SFI) participation (yes or no)
- Treatment cost
- Spray dates
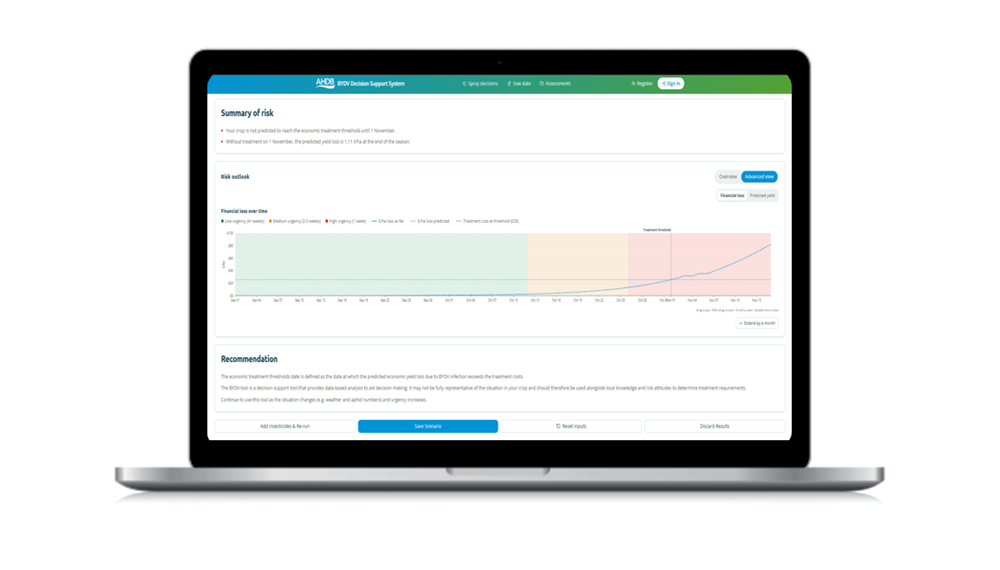
When you run an assessment, the tool indicates the daily risk level for the next few weeks based on the estimated proportion of plants infected. It also shows the potential impact on yield and financial losses.
Critically, it reveals when you need to consider a spray based on the economic threshold, which is the predicted point when the cost associated with yield loss starts to exceed the treatment cost.
Even though aphid activity drops significantly during the winter, the tool will continue to track risk, which is particularly important in our warming climate.
Finally, the tool also projects financial and yield losses over time based on drilling dates. This can inform sowing decisions to minimise BYDV-infection risk and the need for sprays.
In high-risk situations, consider drilling crops after mid-October or grow a variety with BYDV resistance or tolerance – the Recommended Lists for cereal and oilseeds (RL) 2026/27 features several options.
As resistance/tolerance is complex and diverse, the new tool does not currently account for it. However, such varieties are more forgiving when weather forces sub-optimal or missed sprays.
Initial validation work on the model that underpins the tool found it could accurately predict BYDV risk, based on symptom development in untreated crops.
It also guided control as good as or better than the current BYDV tool in treated tramline and plot trials. The best news is that it did this with fewer insecticide applications and provided yield benefits (where BYDV was present).
As a decision support tool, it needs to be used alongside local knowledge and reflect risk attitudes to determine optimum spray dates.
This year, we’ve worked with farmer groups to perfect the tool in time for its mid-August release, which will be available at ahdb.org.uk/bydv
Investment summary
The new tool follows a combined investment in BYDV research of over half a million pounds since 2018, which includes £124,500 (cash and in-kind contributions) from BASF, KWS, Limagrain and Syngenta. The investment covers the final phase of tool development and maintenance until the end of the 2028/29 financial year. ADAS led most of the research and development activity.